INVITE-ONLY SCRIPT
已更新 Trendaid
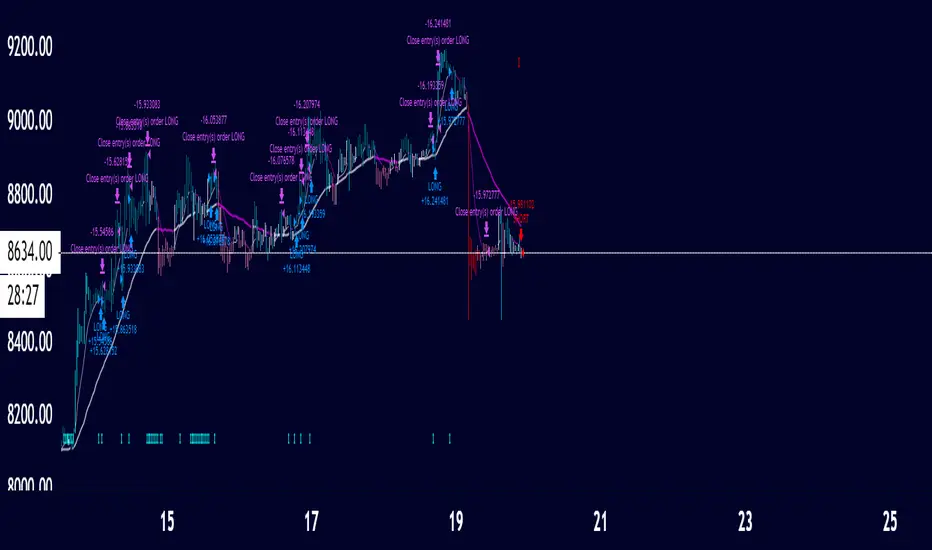
Trendaid
is exactly what the name says
an Aid to Trend
Use this strategy to understand when the trend may shift and then use it to stay in the trends longer
simple strat
Buy when it says BULL in BLUE
Short when it says BEAR in RED
you may close your orders when it says to in PURPLE but unneeded if you want
You can adjust the stop which affects the scripts performance
You may also change from a Long to a Short line but the standard has proven to be the best overall
Let Trendaid guide you to riches
this was primarily designed for #forex but can be used in any market including #crypto
get access by joining the #CCV trading family by visiting the link below
- Cheers
SatoshiHeavy Market analyst for CCV Trading
https://www.cryptocurrentlyvip.com/
版本注释
T Line now changes color based on position of candle lows and highs in regards to the T LineNothing more than a visual
BUT can be used to enter some trades before the actual strategy calls for a trade
Use in conjunction with the candle colors and you should find entry a tad sooner
Purple T Line and -40 SRSI (hot hues) then you can enter short on 2-3 candle closes
White T Line and +60 SRSI (cool hues) then you can enter long on 2-3 candle closes
https://www.tradingview.com/x/uAONw1od/
版本注释
Better signals :)版本注释
1. Less aggressive take profit algo provides for better profit factor2. Hid the T line
3. Removed some settings
THIS INDICATOR MUST BE USED IN CONJUNCTION W HEIKAN ASHI CANDLES
DM me how to attain access or visit https://www.elevate-trading.com/
-Satoshi Heavy
Market Analyst for Elevate-Trading
版本注释
Fixed a script error版本注释
As per request i added the T-line backHelps as a visual as per a few users were saying.
I Also changed one variable i think helped make the algo quicker :)
Cheers!
版本注释
Better losing calls that opt for a better percent profitableThis strategy is now using logic that has the H1 T-line and the H4 T-line on just the H1 chart
Essentially i found the ratio between the H1 T-line and the H4 T-line and multiplied the original formula of the T-line by the ratio then placed that on the chart. if you trace the H4 T-Line it will mirror the T-Line that was multiplied by the ratio
I found the ratio by the difference between the slope of 1 point to another vs the slope of the H4 chart to the same points
H1 and H10 chart seem to be the best but i can see someone using the m15 to success
版本注释
New variables for better accuracy and less of a drawdownTo be used in conjunction with SRSI (Satoshi RSI)
Can be used as an end all be all strategy !
But to lesson the max draw-down on volatile final moves use SRSI divergence and crossover rules to aid TrendAID bias
版本注释
added the D1 13 TrendAID (step line)Added the D1 open, high, low.
Added the w1 open
Tips how to use this
PA below the open = shorts of interest
PA above the open = longs of interest
When Price breaks the high or low it usually moves pretty fast after.
D1 13TredAID is just used for confluence and isnt needed on the chart per say.
CHEERS
版本注释
added the monthly open and also a variable time frame TrendAID You can have any time frame TrendAID on any chart
so you can have the H4 TrendAID on the m5 chart and so forth!
helps with trend trading!
labels are in MINUTES
60= H1
180= H2
240= H4
D= D1
W= W1
M= M1
版本注释
Added Weekly RANGE NOTE
the D high and D low are RANGES just zones where liquidity lies. SO if PA is over D1 open and then gets over the D1 High then usually price moves QUICK. Vice versa for the short side
版本注释
Took away an unneeded variable and also added some back end functional changes that made for a better algo. Same rules apply !版本注释
Took away the levels and made it a stand alone indicator 仅限邀请脚本
只有作者授权的用户才能访问此脚本。您需要申请并获得使用许可。通常情况下,付款后即可获得许可。更多详情,请按照下方作者的说明操作,或直接联系SatoshiHeavy。
TradingView不建议您付费购买或使用任何脚本,除非您完全信任其作者并了解其工作原理。您也可以在我们的社区脚本找到免费的开源替代方案。
作者的说明
Have a plan. Trade it!
免责声明
这些信息和出版物并非旨在提供,也不构成TradingView提供或认可的任何形式的财务、投资、交易或其他类型的建议或推荐。请阅读使用条款了解更多信息。
仅限邀请脚本
只有作者授权的用户才能访问此脚本。您需要申请并获得使用许可。通常情况下,付款后即可获得许可。更多详情,请按照下方作者的说明操作,或直接联系SatoshiHeavy。
TradingView不建议您付费购买或使用任何脚本,除非您完全信任其作者并了解其工作原理。您也可以在我们的社区脚本找到免费的开源替代方案。
作者的说明
Have a plan. Trade it!
免责声明
这些信息和出版物并非旨在提供,也不构成TradingView提供或认可的任何形式的财务、投资、交易或其他类型的建议或推荐。请阅读使用条款了解更多信息。