OPEN-SOURCE SCRIPT
Price Filter [AstrideUnicorn]
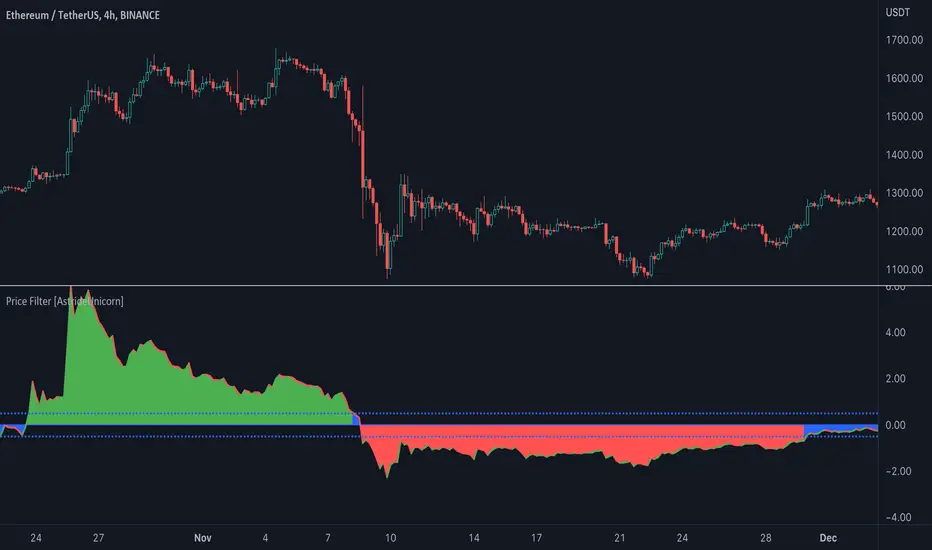
The indicator calculates a fast price filter based on the closing price of the underlying asset. Overall, it is intended to provide a fast, reliable way to detect trend direction and confirm trend strength, using statistical measures of price movements.
The algorithm was adapted from Marcus Schmidberger's (2018) article "High Frequency Trading with the MSCI World ETF". It demeans the price time series using the long-term average and then normalizes it with the long-term standard deviation. The resulting time series is then compared to specified thresholds to determine the trend direction.
HOW TO USE
The indicator surface is colored green if the price is trending upwards and red if the price is trending downwards. If the indicator outline is the opposite color of the indicator surface, it indicates that the price is moving against the trend and the current trend may be losing strength.
If the 'Use threshold' setting is enabled, the indicator will be colored blue if its value is within the range defined by the upper and lower thresholds. This indicates that the price is trending sideways, or that the current trend is losing strength.
SETTNGS
Length - the length of the long-term average used to calculate the price filter. Recommended range 20 - 200. The sensitivity of the indicator increases as the value becomes smaller, allowing it to detect smaller price moves and swings earlier.
Threshold- the threshold value used to detect trend direction.
Use threshold - a boolean (true/false) input that determines whether to use the threshold value for confirmation.
开源脚本
秉承TradingView的精神,该脚本的作者将其开源,以便交易者可以查看和验证其功能。向作者致敬!您可以免费使用该脚本,但请记住,重新发布代码须遵守我们的网站规则。
Our premium trading indicators: unicorn.trading
Join our Discord community: dsc.gg/unicom
Join our Discord community: dsc.gg/unicom
免责声明
这些信息和出版物并非旨在提供,也不构成TradingView提供或认可的任何形式的财务、投资、交易或其他类型的建议或推荐。请阅读使用条款了解更多信息。