OPEN-SOURCE SCRIPT
已更新 Multi-time Frame Trend Direction

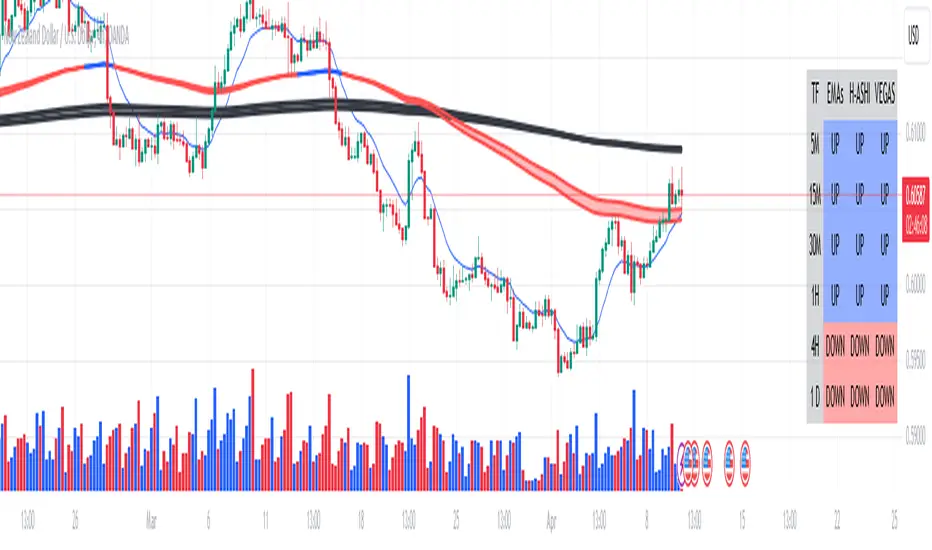
This is a multi-time frame trend direction indicator. It indicates whether the trend is ascending or descending across multiple time frames: 5M, 15M, 30M, 1H, 4H, and Daily.
The logic is based on the positions of EMA12 and EMA26.
These EMAs are smoothed with an SMA.
Why 12 and 26, and why are they smoothed with 9?
As you might surmise, these parameters are derived from the MACD.
I recommend not altering the parameters, but the choice is yours. Enjoy.
The logic is based on the positions of EMA12 and EMA26.
These EMAs are smoothed with an SMA.
Why 12 and 26, and why are they smoothed with 9?
As you might surmise, these parameters are derived from the MACD.
I recommend not altering the parameters, but the choice is yours. Enjoy.
版本注释
I used 3 trend system:1. Golden Cross, Ema200 and Ema50
2. Heikinashi trend system by © Dziwne "Trend Indicator A-V2 (Smoothed Heikin Ashi Cloud) [Dziwne] by DZIV". I converted and updated.
3. Famous Vegas Trading system. Ema12, Ema144 and Ema169
I used 5 Min, 15Min, 30 Min, 60 Min, 4 Hour and Daily.
I believe it works most of the time.
Enjoy!
开源脚本
秉承TradingView的精神,该脚本的作者将其开源,以便交易者可以查看和验证其功能。向作者致敬!您可以免费使用该脚本,但请记住,重新发布代码须遵守我们的网站规则。
免责声明
这些信息和出版物并非旨在提供,也不构成TradingView提供或认可的任何形式的财务、投资、交易或其他类型的建议或推荐。请阅读使用条款了解更多信息。
开源脚本
秉承TradingView的精神,该脚本的作者将其开源,以便交易者可以查看和验证其功能。向作者致敬!您可以免费使用该脚本,但请记住,重新发布代码须遵守我们的网站规则。
免责声明
这些信息和出版物并非旨在提供,也不构成TradingView提供或认可的任何形式的财务、投资、交易或其他类型的建议或推荐。请阅读使用条款了解更多信息。