OPEN-SOURCE SCRIPT
High/Low Weekly Timeframe
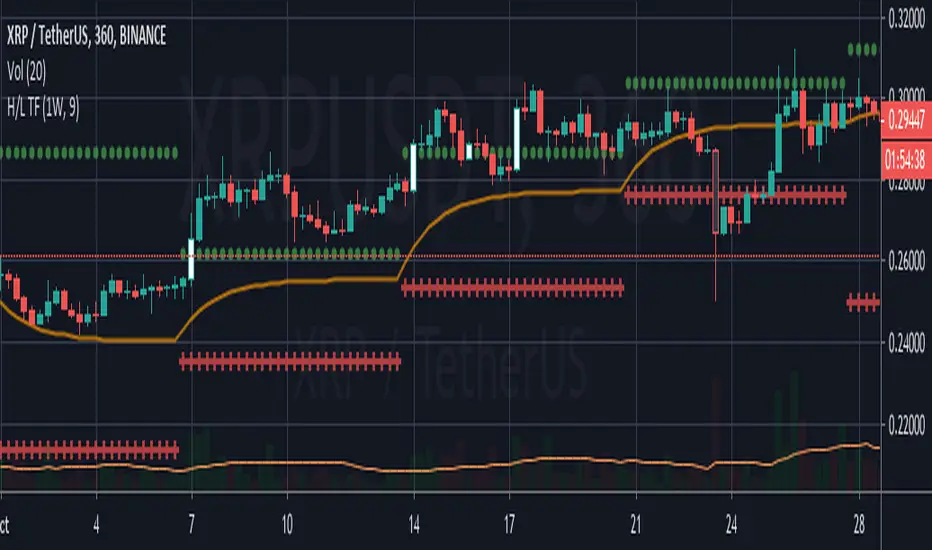
I'm testing a simple but useful indicator that plots the high and low for the current week. The time-frame can be selected by the user.
It's useful when you're trading in a smaller time-frame (example: 1H or 4H) to know exactly the weekly low and high, and whether the price breaks above or below this price lines.
This indicator allows you:
- To select the desired time-frame to get the Low and High.
- To print an optional EMA for the same time-frame.
- To optionally change the bar-color when the close price crosses above the weekly high or crosses below the weekly low.
Hope this helps you to visually identify price movements.
If you like this script please give me a like and comment below.
Thanks,
Rodrigo
开源脚本
秉承TradingView的精神,该脚本的作者将其开源,以便交易者可以查看和验证其功能。向作者致敬!您可以免费使用该脚本,但请记住,重新发布代码须遵守我们的网站规则。
免责声明
这些信息和出版物并非旨在提供,也不构成TradingView提供或认可的任何形式的财务、投资、交易或其他类型的建议或推荐。请阅读使用条款了解更多信息。
开源脚本
秉承TradingView的精神,该脚本的作者将其开源,以便交易者可以查看和验证其功能。向作者致敬!您可以免费使用该脚本,但请记住,重新发布代码须遵守我们的网站规则。
免责声明
这些信息和出版物并非旨在提供,也不构成TradingView提供或认可的任何形式的财务、投资、交易或其他类型的建议或推荐。请阅读使用条款了解更多信息。