OPEN-SOURCE SCRIPT
FLD's - Future Lines of Demarcation Backtest
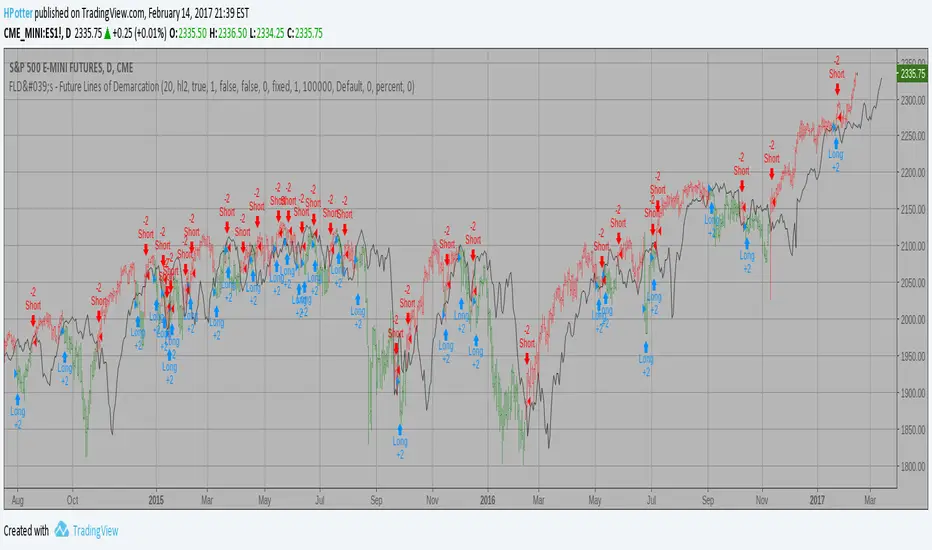
An FLD is a line that is plotted on the same scale as the price and is in fact the
price itself displaced to the right (into the future) by (approximately) half the
wavelength of the cycle for which the FLD is plotted. There are three FLD's that can be
plotted for each cycle:
An FLD based on the median price.
An FLD based on the high price.
An FLD based on the low price.
price itself displaced to the right (into the future) by (approximately) half the
wavelength of the cycle for which the FLD is plotted. There are three FLD's that can be
plotted for each cycle:
An FLD based on the median price.
An FLD based on the high price.
An FLD based on the low price.
开源脚本
秉承TradingView的精神,该脚本的作者将其开源,以便交易者可以查看和验证其功能。向作者致敬!您可以免费使用该脚本,但请记住,重新发布代码须遵守我们的网站规则。
免责声明
这些信息和出版物并非旨在提供,也不构成TradingView提供或认可的任何形式的财务、投资、交易或其他类型的建议或推荐。请阅读使用条款了解更多信息。
开源脚本
秉承TradingView的精神,该脚本的作者将其开源,以便交易者可以查看和验证其功能。向作者致敬!您可以免费使用该脚本,但请记住,重新发布代码须遵守我们的网站规则。
免责声明
这些信息和出版物并非旨在提供,也不构成TradingView提供或认可的任何形式的财务、投资、交易或其他类型的建议或推荐。请阅读使用条款了解更多信息。