OPEN-SOURCE SCRIPT
已更新 Max/Min Levels
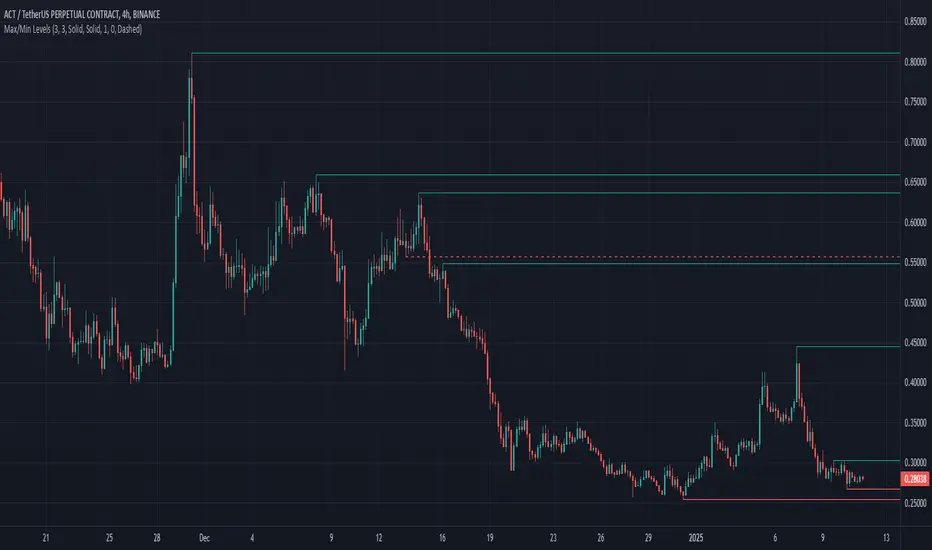
Highlights highs and lows that match the search criteria. A high is considered to be broken if the candlestick breaks through its shadow
A three-candlestick pattern will match the parameters:
A five-candlestick pattern will match the parameters:
A three-candlestick pattern will match the parameters:
- Candle before - 1
- Candle after - 1
A five-candlestick pattern will match the parameters:
- Candle before - 2
- Candle after - 2
版本注释
Highlights highs and lows that match the search criteria. A high is considered to be broken if the candlestick breaks through its shadowA three-candlestick pattern will match the parameters:
- Candle before - 1
- Candle after - 1
A five-candlestick pattern will match the parameters:
- Candle before - 2
- Candle after - 2
版本注释
Fixed the issue of false lines appearing at the beginning of the chart版本注释
Added the option to delete the line immediately after it is crossed or after the candle formation is complete版本注释
In history, the line continues until it touches a candlestick.Also, the number of lines that can be displayed on the chart has been increased to 150.
版本注释
Shows the highs and lows that were broken by a single candle版本注释
Added the ability to set the number of lines to be displayed on the chart版本注释
Added the ability to enable level breakdown notificationsFirst, mark which notifications you want to receive, about a level breakout or a breakout of resistance and support levels (dashed line on the chart).
Create a new alert and in the "Condition" column select the indicator name. In the column below select "Any alert() function call" if it is not selected and click the "Create" button. That's it, you're done
版本注释
Added the ability to use the indicator in Pine Screener. Allows you to conveniently search for coins that have a broken level or a pricked level, and also how many percent to the nearest level- New Tab -> Screeners -> Pine (Beta)
https://i.postimg.cc/T1WqyWv4/Max-Min-Screener-1.jpg
- A list with coin pairs
- A timeframe for analysis
- Indicator settings
- Setup the indicator according to your requirements
- Check the box next to "Candle number" to make the indicator work in "Pine Screener" mode
- 0 - analysis of the current candle, 1 - analysis of the second candle on the chart, 2,3... etc.
- Confirm settings
- Click "Scan"
After that, you will see a window with the data
https://i.postimg.cc/wMcJYCCc/Max-Min-Screener-2.jpg
- To Up, To Down, To Broken Up, To Broken Down - Shows how many percent to the nearest level. If the value is negative, it means that the price broke the level
- Pricked Up, Pricked Down, Pricked Broken Up, Pricked Broken Down - "1" means that the price pierced the level with its shadow
Good luck with your search everyone!
开源脚本
秉承TradingView的精神,该脚本的作者将其开源,以便交易者可以查看和验证其功能。向作者致敬!您可以免费使用该脚本,但请记住,重新发布代码须遵守我们的网站规则。
免责声明
这些信息和出版物并非旨在提供,也不构成TradingView提供或认可的任何形式的财务、投资、交易或其他类型的建议或推荐。请阅读使用条款了解更多信息。
免责声明
这些信息和出版物并非旨在提供,也不构成TradingView提供或认可的任何形式的财务、投资、交易或其他类型的建议或推荐。请阅读使用条款了解更多信息。