OPEN-SOURCE SCRIPT
Volume change [ Unlimited ]
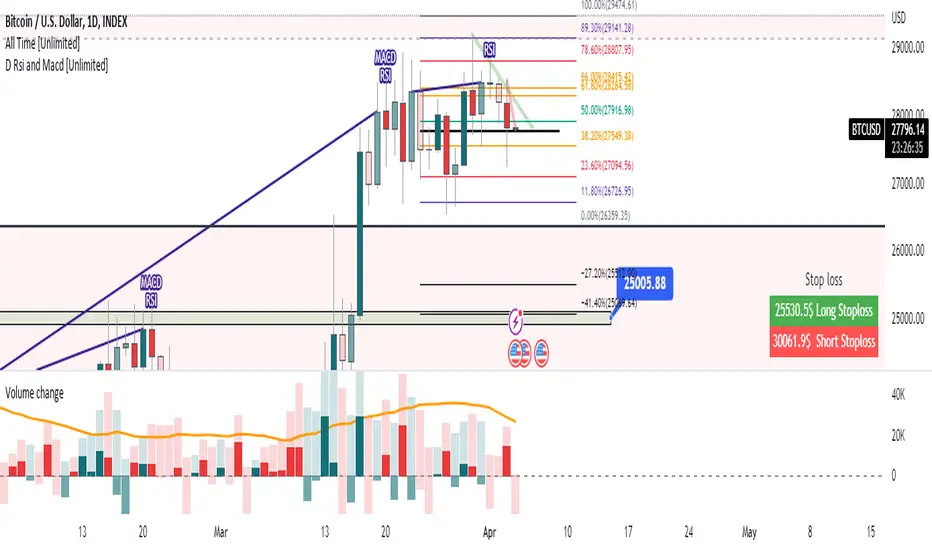
This indicator displays volume and volume change information on a chart. It is designed to help traders analyze changes in trading volume over time and identify potential trading opportunities.
The indicator takes an input from the user to set the length of the exponential moving average (EMA) applied to the volume data. This EMA is used to smooth out short-term fluctuations in volume and highlight the overall trend in volume.
The indicator calculates whether the current bar is up or down and calculates the change in volume. It then sets the color of the volume and volume change columns based on whether the bar is up or down and whether the volume change is positive or negative.
By displaying this information on a chart, the indicator can help traders identify patterns or trends in volume and volume change that may indicate potential trading opportunities. For example, increasing volume along with rising prices could indicate strong buying pressure and a potential bullish trend, while decreasing volume along with falling prices could indicate weak selling pressure and a potential bearish trend.
开源脚本
秉承TradingView的精神,该脚本的作者将其开源,以便交易者可以查看和验证其功能。向作者致敬!您可以免费使用该脚本,但请记住,重新发布代码须遵守我们的网站规则。
免责声明
这些信息和出版物并非旨在提供,也不构成TradingView提供或认可的任何形式的财务、投资、交易或其他类型的建议或推荐。请阅读使用条款了解更多信息。
开源脚本
秉承TradingView的精神,该脚本的作者将其开源,以便交易者可以查看和验证其功能。向作者致敬!您可以免费使用该脚本,但请记住,重新发布代码须遵守我们的网站规则。
免责声明
这些信息和出版物并非旨在提供,也不构成TradingView提供或认可的任何形式的财务、投资、交易或其他类型的建议或推荐。请阅读使用条款了解更多信息。