PROTECTED SOURCE SCRIPT
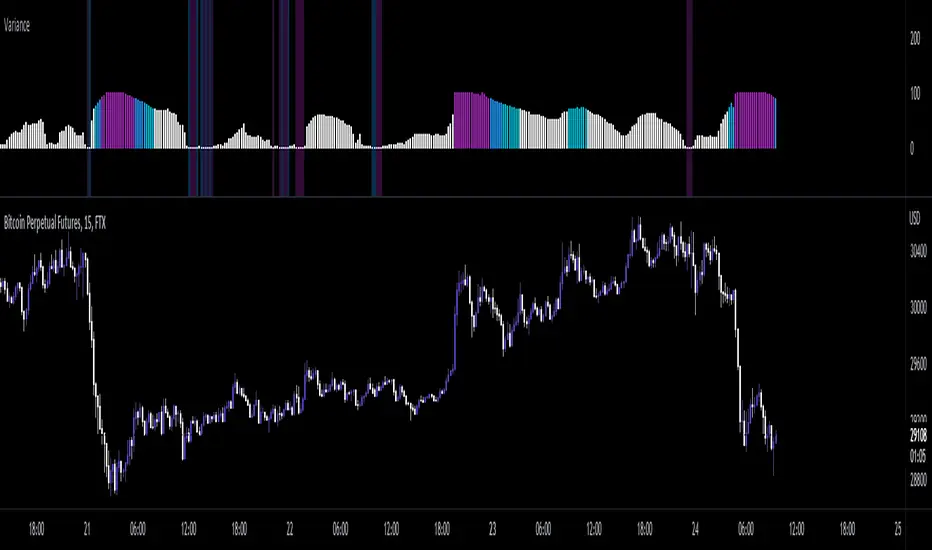
Variance Percentile
As repeated from my Variance Z-Score Script:
"Variance is a measure of dispersion, simply put, it is measuring how distant data is from it's mean(average). This indicator allows you to see when variance is increasing or decreasing, as well as when it is at an extreme value. Thru this, you can get a more accurate description of risk. When variance is increasing/high, you know to expect larger moves, as data(price) is far and getting farther from the mean. and when it is low/decreasing, you know that price movement is more likely to be less volatile due to data clustering closer to the mean, ie ; smaller values."
With Variance Percentile, we apply a percent rank function to get some statistical context from raw variance data. Used the same as my pervious Historical volatility indicator, it shows what % of historical data was less than or equal to the current value, allowing us to find point where variance is statistically likely to increase, as well as when it is at an extreme.
Recommended to paired with Historical volatility or Volatility Z-score to assist in establishing a more accurate estimation of market volatility
受保护脚本
此脚本以闭源形式发布。 但是,您可以自由使用,没有任何限制 — 了解更多信息这里。
免责声明
这些信息和出版物并非旨在提供,也不构成TradingView提供或认可的任何形式的财务、投资、交易或其他类型的建议或推荐。请阅读使用条款了解更多信息。
受保护脚本
此脚本以闭源形式发布。 但是,您可以自由使用,没有任何限制 — 了解更多信息这里。
免责声明
这些信息和出版物并非旨在提供,也不构成TradingView提供或认可的任何形式的财务、投资、交易或其他类型的建议或推荐。请阅读使用条款了解更多信息。