OPEN-SOURCE SCRIPT
已更新 Comparative Relative Strength of a stock
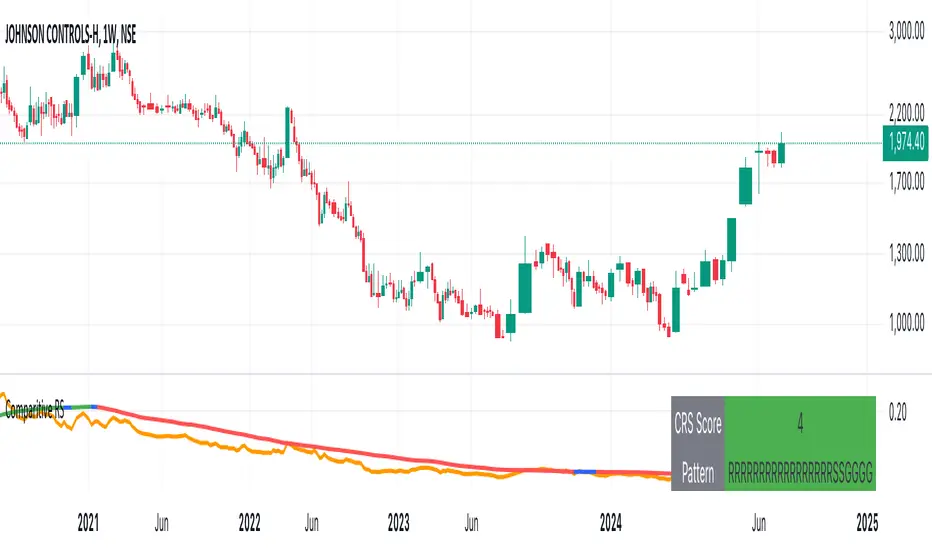
Perform comparative relative strength of a stock. Default base is NIFTY 50.
版本注释
Cosmetic changes to make the display pretty and input choices in more logical sequence.版本注释
Added input as source. Some cosmetic changes.版本注释
- version 5
- Added color code for CRS moving average
A color-based trend on the Ratio moving average. The trend lookback is configurable.
版本注释
- Possible to plot candles, of ratio chart, instead of line chart only.
版本注释
Updated to include a "CRS Score" and "CRS Pattern"- CRS Score: The number of consecutive bars, when the trend of the relative strength is increasing/decreasing. If CRS is falling, score will be negative, if rising, score will be positive and 0 if it is neither positive nor negative (blue)
- CRS Pattern: The pattern of the last 23 (default) bars for the CRS Trend.
If say, the CRS Pattern is RRRRRRRRRSSGG - It means that after 11 bars, the strength is now positive for last 2 bars. This is a good way to visualise a turn around in relative strength of the stock. Higher the number of opposite trend the greater that chance of the reversal.
开源脚本
秉承TradingView的精神,该脚本的作者将其开源,以便交易者可以查看和验证其功能。向作者致敬!您可以免费使用该脚本,但请记住,重新发布代码须遵守我们的网站规则。
免责声明
这些信息和出版物并非旨在提供,也不构成TradingView提供或认可的任何形式的财务、投资、交易或其他类型的建议或推荐。请阅读使用条款了解更多信息。
开源脚本
秉承TradingView的精神,该脚本的作者将其开源,以便交易者可以查看和验证其功能。向作者致敬!您可以免费使用该脚本,但请记住,重新发布代码须遵守我们的网站规则。
免责声明
这些信息和出版物并非旨在提供,也不构成TradingView提供或认可的任何形式的财务、投资、交易或其他类型的建议或推荐。请阅读使用条款了解更多信息。