OPEN-SOURCE SCRIPT
HARSI - HeikinAshi RSI (with Bollinger Bands)
This is my first published script. I hope it might be useful!
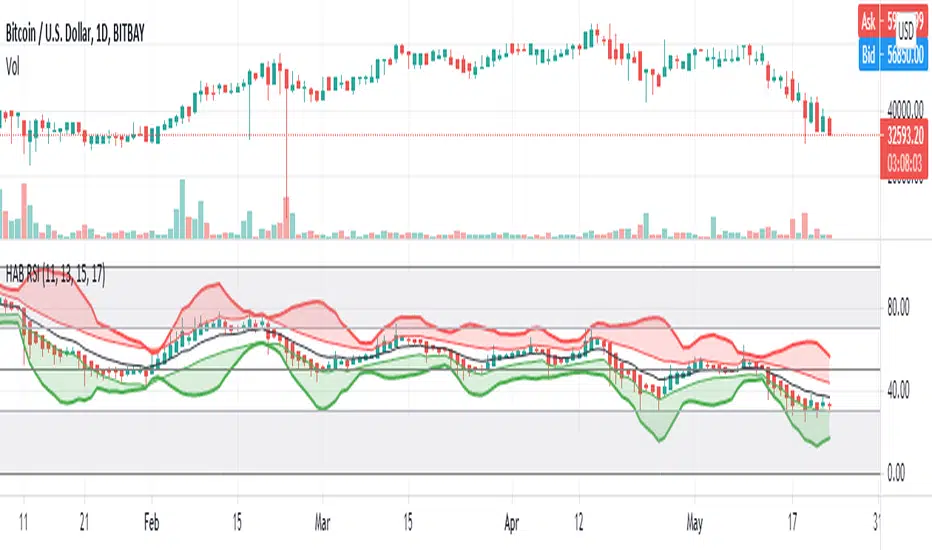
This is a modified RSI that attempts to give smoother values. It takes 4 different input lengths and plots them in a similar way as Heikin-Ashi candles does.
It can be used in the same way as a regular RSI.
It also includes Bollinger Bands that might help identify overbought/oversold situations.
The script uses a slightly modified Allanster's 'Heikin Ashi source function' (many thanks for that very useful script!).
开源脚本
秉承TradingView的精神,该脚本的作者将其开源,以便交易者可以查看和验证其功能。向作者致敬!您可以免费使用该脚本,但请记住,重新发布代码须遵守我们的网站规则。
免责声明
这些信息和出版物并非旨在提供,也不构成TradingView提供或认可的任何形式的财务、投资、交易或其他类型的建议或推荐。请阅读使用条款了解更多信息。
免责声明
这些信息和出版物并非旨在提供,也不构成TradingView提供或认可的任何形式的财务、投资、交易或其他类型的建议或推荐。请阅读使用条款了解更多信息。