OPEN-SOURCE SCRIPT
已更新 Advanced Trend Detection Strategy
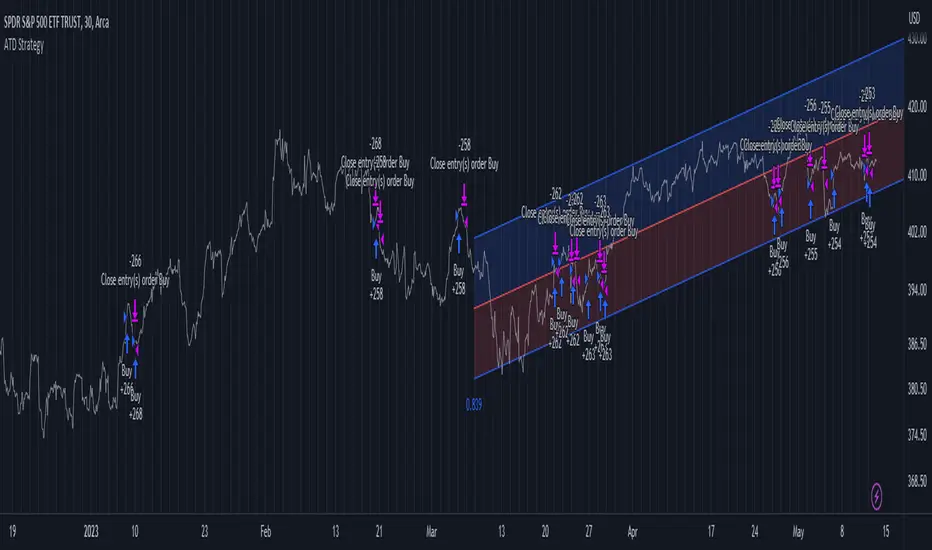
The Advanced Trend Detection Strategy is a sophisticated trading algorithm based on the indicator "Percent Levels From Previous Close".
This strategy is based on calculating the Pearson's correlation coefficient of logarithmic-scale linear regression channels across a range of lengths from 50 to 1000. It then selects the highest value to determine the length for the channel used in the strategy, as well as for the computation of the Simple Moving Average (SMA) that is incorporated into the strategy.
In this methodology, a script is applied to an equity in which multiple length inputs are taken into consideration. For each of these lengths, the slope, average, and intercept are calculated using logarithmic values. Deviation, the Pearson's correlation coefficient, and upper and lower deviations are also computed for each length.
The strategy then selects the length with the highest Pearson's correlation coefficient. This selected length is used in the channel of the strategy and also for the calculation of the SMA. The chosen length is ultimately the one that best fits the logarithmic regression line, as indicated by the highest Pearson's correlation coefficient.
In short, this strategy leverages the power of Pearson's correlation coefficient in a logarithmic scale linear regression framework to identify optimal trend channels across a broad range of lengths, assisting traders in making more informed decisions.
版本注释
plot selectedMA开源脚本
秉承TradingView的精神,该脚本的作者将其开源,以便交易者可以查看和验证其功能。向作者致敬!您可以免费使用该脚本,但请记住,重新发布代码须遵守我们的网站规则。
Plan the trade ⚡ Trade the plan
免责声明
这些信息和出版物并非旨在提供,也不构成TradingView提供或认可的任何形式的财务、投资、交易或其他类型的建议或推荐。请阅读使用条款了解更多信息。
开源脚本
秉承TradingView的精神,该脚本的作者将其开源,以便交易者可以查看和验证其功能。向作者致敬!您可以免费使用该脚本,但请记住,重新发布代码须遵守我们的网站规则。
Plan the trade ⚡ Trade the plan
免责声明
这些信息和出版物并非旨在提供,也不构成TradingView提供或认可的任何形式的财务、投资、交易或其他类型的建议或推荐。请阅读使用条款了解更多信息。