INVITE-ONLY SCRIPT
已更新 FSS Indicator MTF Screener 2.0 -- by @Flokicrypto
FSS Indicator MTF Screener is built so that the user can scan the target coin quickly to see on which timeframes FSS Buy or Sell signals have shown up in the last closed candle on a range of timeframes. This saves both the time and effort of having to browse through multiple timeframes. By using this script the user will be able to quickly screen through a list of coins and read what the FSS indicator is telling, without touching the timeframe. Its uniqueness and originality is tightly related to its tandem work with the FSS Indicator (You can find the description of this indicator below).
The screener is true Multi Time Frame, in that the information is fetched via security requests on other timeframes, and not calculated within the script. This script only makes use of the last close candle, but later versions could include the current candle.
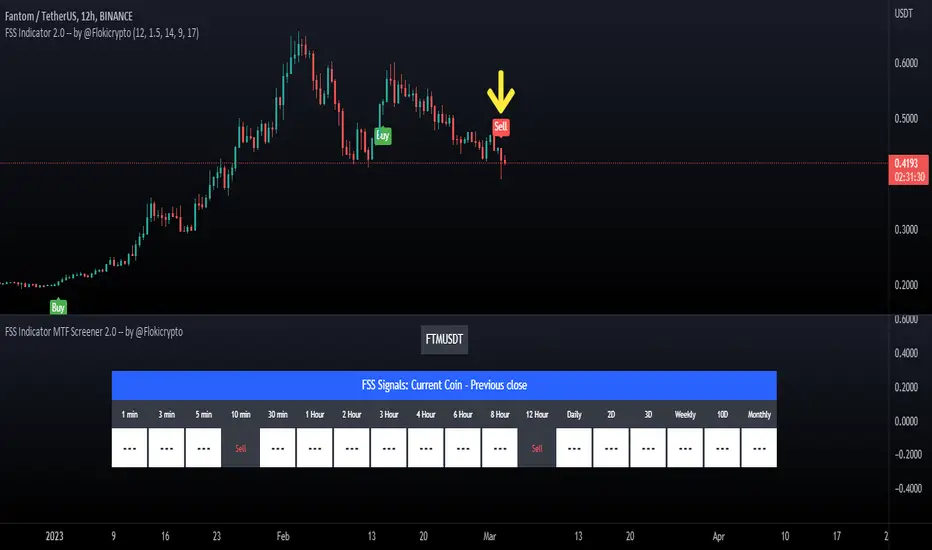
Above you can see a Sell signal on FTMUSDT on the 12H Timeframe on the chart and its corresponding signal on the Screener just under the chart.
Below is another example of the S&P/TSX Composite Index printing a 12H Buy signal on that same 12H Timeframe and its corresponding signal within the screener window.

** The format of the table, cells and text can be changed without notice, but it is my plan to make as many things as possible with regards to the table, editable by the user in the long term.
About the FSS Indicator:
This FSS Indicator script (which is included within this screener) is unique not only in that it removes the need for the user to run each of these indicators individually; it provides an ‘at-a-glance’ summary of the aggregate indicator data, while also providing the user a simultaneous recommended stop loss value based on past market behavior for the given asset and the user's tolerance to risk by editing the ATR Multiplier in the inputs.
The basic concept of the script is to apply past data to present market conditions, and through the use of that data, provide an additional confluence/confirmation signal which simultaneously provides a recommended stop loss value based on average true range (ATR).
The FSS Indicator uses a blend of :
RSI: If within a defined RSI range, increments print score.
MACD: trend and crossovers increment print score.
Histogram: increments print score if a trend of X candles is up or down.
21 EMA: Increments print score if price is above/below 21EMA.
Parabolic SAR: Increments print score if price is above/below Parabolic SAR .
These parameters generate a print score, which is then determined to be sufficient or not to print a LONG or a SHORT signal on the candle.
The indicator isn't built to find bottoms or tops, won't trigger 100% of the time, but should see a high success rate when triggered on higher timeframes. After testing on several pairs/tickers ( Bitcoin , Ethereum , XRP, DJI, SPX and others) on multiple timeframes I have seen the best results on 12-hour, Daily, 2-day, 3-day & weekly timeframes. The success criteria are as follows: Stop Loss not hitting before a rise of at least 10% in value for a long, or a loss of at least 10% in value for a short; waiting until the signal-candle closes for confirmation and back testing.
**Disclaimer: The recommendations of the Indicator/Screener are the result of back-tests and past results will never guarantee future performance of this script on any chart.**
The screener is true Multi Time Frame, in that the information is fetched via security requests on other timeframes, and not calculated within the script. This script only makes use of the last close candle, but later versions could include the current candle.
Above you can see a Sell signal on FTMUSDT on the 12H Timeframe on the chart and its corresponding signal on the Screener just under the chart.
Below is another example of the S&P/TSX Composite Index printing a 12H Buy signal on that same 12H Timeframe and its corresponding signal within the screener window.
** The format of the table, cells and text can be changed without notice, but it is my plan to make as many things as possible with regards to the table, editable by the user in the long term.
About the FSS Indicator:
This FSS Indicator script (which is included within this screener) is unique not only in that it removes the need for the user to run each of these indicators individually; it provides an ‘at-a-glance’ summary of the aggregate indicator data, while also providing the user a simultaneous recommended stop loss value based on past market behavior for the given asset and the user's tolerance to risk by editing the ATR Multiplier in the inputs.
The basic concept of the script is to apply past data to present market conditions, and through the use of that data, provide an additional confluence/confirmation signal which simultaneously provides a recommended stop loss value based on average true range (ATR).
The FSS Indicator uses a blend of :
RSI: If within a defined RSI range, increments print score.
MACD: trend and crossovers increment print score.
Histogram: increments print score if a trend of X candles is up or down.
21 EMA: Increments print score if price is above/below 21EMA.
Parabolic SAR: Increments print score if price is above/below Parabolic SAR .
These parameters generate a print score, which is then determined to be sufficient or not to print a LONG or a SHORT signal on the candle.
The indicator isn't built to find bottoms or tops, won't trigger 100% of the time, but should see a high success rate when triggered on higher timeframes. After testing on several pairs/tickers ( Bitcoin , Ethereum , XRP, DJI, SPX and others) on multiple timeframes I have seen the best results on 12-hour, Daily, 2-day, 3-day & weekly timeframes. The success criteria are as follows: Stop Loss not hitting before a rise of at least 10% in value for a long, or a loss of at least 10% in value for a short; waiting until the signal-candle closes for confirmation and back testing.
**Disclaimer: The recommendations of the Indicator/Screener are the result of back-tests and past results will never guarantee future performance of this script on any chart.**
版本注释
7.0 code version: Remove top row merge cell from table "if" so the function executes regardless of barstate. 8.0 code version: Added 8m TF
仅限邀请脚本
只有作者授权的用户才能访问此脚本。您需要申请并获得使用许可。通常情况下,付款后即可获得许可。更多详情,请按照下方作者的说明操作,或直接联系FlokiCrypto。
TradingView不建议您付费购买或使用任何脚本,除非您完全信任其作者并了解其工作原理。您也可以在我们的社区脚本找到免费的开源替代方案。
作者的说明
Access to this script can be obtained by sending me a message on twitter: twitter.com/FlokiCrypto
免责声明
这些信息和出版物并非旨在提供,也不构成TradingView提供或认可的任何形式的财务、投资、交易或其他类型的建议或推荐。请阅读使用条款了解更多信息。