OPEN-SOURCE SCRIPT
ES S/R Levels
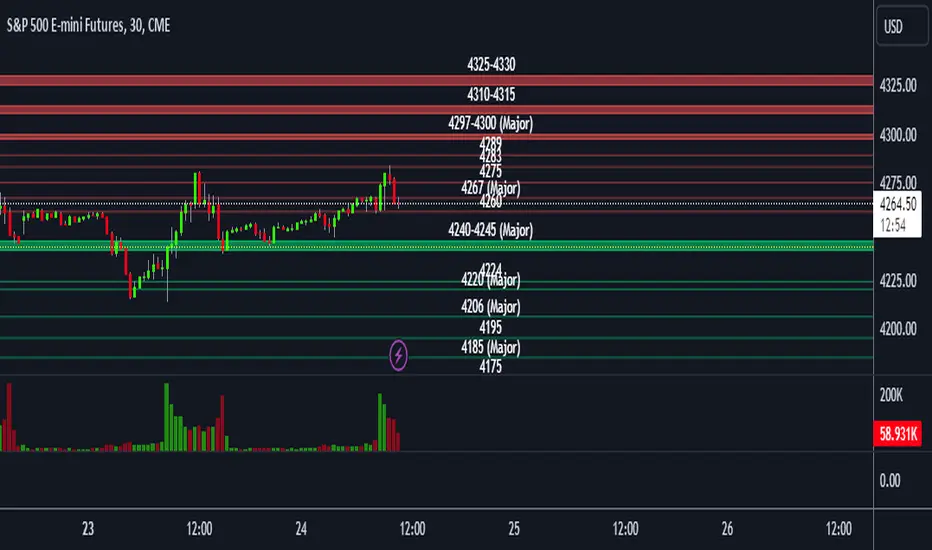
This script plots support and resistance levels for /ES on your chart.
This script only works on the /ES symbol in Tradingview due to the string manipulation of the levels.
You can input support and resistance levels in the inputs.
The example format of S/R levels should be in the following form (comma-separated)
If the level is a single point, it will draw a line. If the level is a range, it will draw a box.
4260, 4267, 4275, 4283, 4289, 4297-4300, 4310-15, 4325-30
You can also add the keyword (major) in your S/R levels input which will add a (Major) label to the drawing
4260, 4267 (major), 4275, 4283, 4289, 4297-4300 (major), 4310-15, 4325-30
开源脚本
秉承TradingView的精神,该脚本的作者将其开源,以便交易者可以查看和验证其功能。向作者致敬!您可以免费使用该脚本,但请记住,重新发布代码须遵守我们的网站规则。
免责声明
这些信息和出版物并非旨在提供,也不构成TradingView提供或认可的任何形式的财务、投资、交易或其他类型的建议或推荐。请阅读使用条款了解更多信息。
开源脚本
秉承TradingView的精神,该脚本的作者将其开源,以便交易者可以查看和验证其功能。向作者致敬!您可以免费使用该脚本,但请记住,重新发布代码须遵守我们的网站规则。
免责声明
这些信息和出版物并非旨在提供,也不构成TradingView提供或认可的任何形式的财务、投资、交易或其他类型的建议或推荐。请阅读使用条款了解更多信息。