OPEN-SOURCE SCRIPT
Finnie's RSI with EMA crossover + Stoch
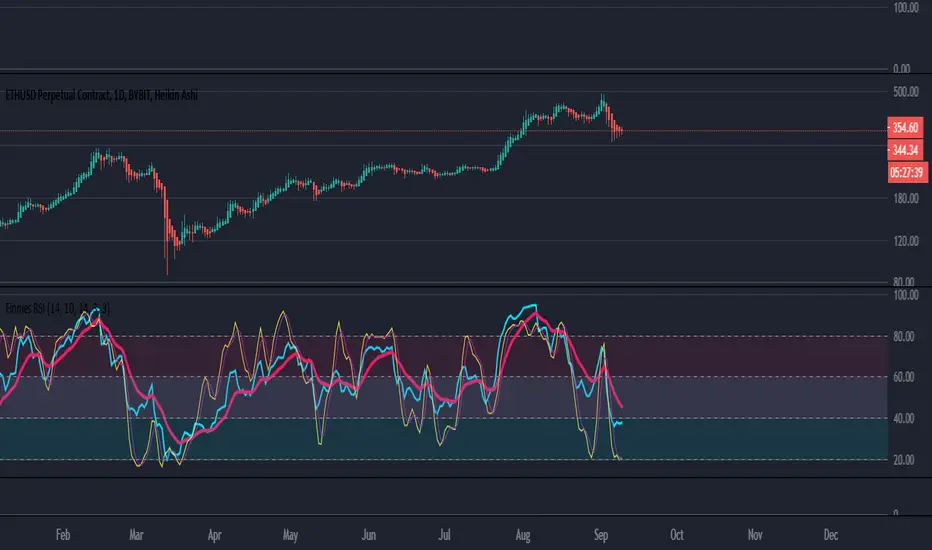
RSI seams to be one of the most used indicators by far, and that comes because of merit. With that in mind, the goal of this indicator is to expand upon the tradition RSI or Relative Strength Index we all know and love :) I started by adding an EMA crossover. Which gives you, the users, a general idea of when to buy and sell outside of just watching a line go down and up. To take thinks even further, I decided to add options for both Fast and Slow Stochastic oscillators. Adding STOCH brings in another variable when deciding on an entry, technically its a bit hard to explain but in practice it would go something like this: you notice RSI is down around the level 20 mark and RSI is crossing up above it's EMA, which is BULLISH signal, and you're thinking about going long. As a second confirmation you can look at the STOCH rsi, if it's also crossing above the previously spoken EMA that's another BULLISH signal. This process can be repeated once RSI has risen to find an exit.
EDIT: If you find the indicator is a bit too cluttered for you, feel free to disable the 'STOCH rsi' feature in settings :)
EDIT: If you find the indicator is a bit too cluttered for you, feel free to disable the 'STOCH rsi' feature in settings :)
开源脚本
秉承TradingView的精神,该脚本的作者将其开源,以便交易者可以查看和验证其功能。向作者致敬!您可以免费使用该脚本,但请记住,重新发布代码须遵守我们的网站规则。
免责声明
这些信息和出版物并非旨在提供,也不构成TradingView提供或认可的任何形式的财务、投资、交易或其他类型的建议或推荐。请阅读使用条款了解更多信息。
开源脚本
秉承TradingView的精神,该脚本的作者将其开源,以便交易者可以查看和验证其功能。向作者致敬!您可以免费使用该脚本,但请记住,重新发布代码须遵守我们的网站规则。
免责声明
这些信息和出版物并非旨在提供,也不构成TradingView提供或认可的任何形式的财务、投资、交易或其他类型的建议或推荐。请阅读使用条款了解更多信息。