OPEN-SOURCE SCRIPT
Using The AM/GM Inequality To Estimate Volatility
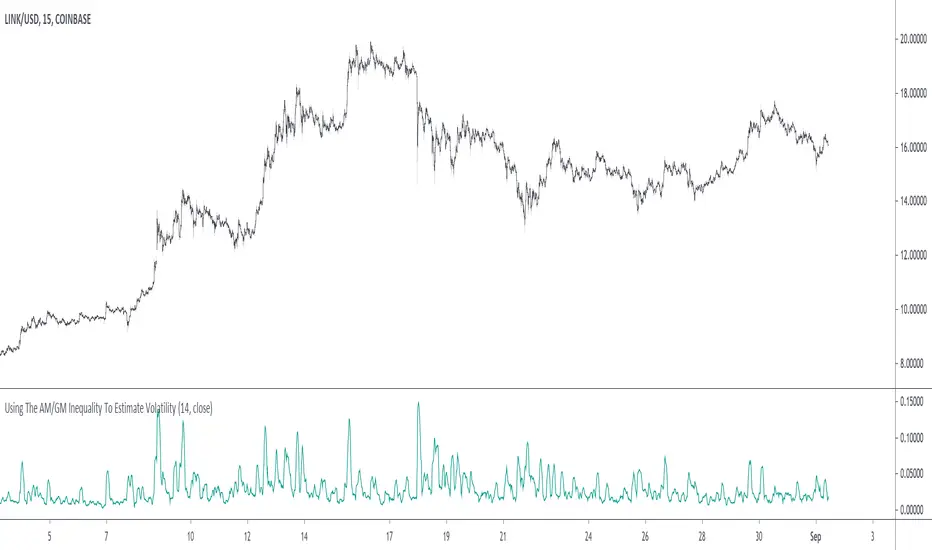
A volatility indicator derived from the AM/GM inequality. I don't think it will be necessary to describe the usage and interpretation of such indicator, and I don't think it is super useful, however, this is not the case of the script, which contains three ways to compute the geometric mean, with a classic, a simple, and an efficient way. The AM/GM inequality is also a really interesting concept, and I'll try to"prove" it in this post by using DSP. I also added more comments in the script in order to highlight some stuff.
The AM/GM Inequality
When we talk about the mean, we are referring to the "arithmetic" one by default, but there exist more types of means. Two other ones include the "geometric" and "harmonic" means, both are part of the Pythagorean means with the arithmetic mean.
Each one of them as several properties, but the most interesting aspect is their inequality, that is:
HM <= GM <= AM
The arithmetic mean is the one with the highest value, while the harmonic mean is the one with the lowest value. In the case each data point is equal to each other, all the means have the same value.
In our case, the inequality of interest is the inequality between the geometric and arithmetic mean, where the geometric mean is lower or equal than the arithmetic one. Many proofs/explanations exist, I'll try my version using DSP, where instead of thinking about means, we think about rolling means, which allows us to interpret them as low-pass filters. So we end up having the geometric moving average (GMA) and arithmetic moving average (SMA).
We know that GMA <= SMA, the SMA has a unity passband, this implies that the GMA has a passband lower than 1 (for non-equal input values), this explains why the GMA is smaller than the SMA. In order for a FIR filter to have a passband lower than 1, the sum of the filter coefficients must be lower than 1. In order to further proves this consider the following equation:
Pine Script®
Here sqrt(a×b) is the geometric mean of a and b, the right-hand side of the equation is a weighted sum between a and b and coefficient k, we want to solve the equation with respect to k, if k×2 < 1 then we have the proof that GMA < SMA. The solution with respect to k is:
Pine Script®
which always gives a number lower than 0.5, as such k×2 < 1 and thus the passband is lower than 1. If our input values are equal to each other, we end up with the following solution for k:
Pine Script®
as such the GMA has the coefficients of an SMA as long as the input values are equal to each other.
Because of this inequality, we can subtract the SMA to a GMA and take the square root of the result in order to have a volatility indicator, however, both moving averages are still pretty close to each other, which gives a very small result for the indicator.
Uwu I am a bit tired, better indicators coming up
The AM/GM Inequality
When we talk about the mean, we are referring to the "arithmetic" one by default, but there exist more types of means. Two other ones include the "geometric" and "harmonic" means, both are part of the Pythagorean means with the arithmetic mean.
Each one of them as several properties, but the most interesting aspect is their inequality, that is:
HM <= GM <= AM
The arithmetic mean is the one with the highest value, while the harmonic mean is the one with the lowest value. In the case each data point is equal to each other, all the means have the same value.
In our case, the inequality of interest is the inequality between the geometric and arithmetic mean, where the geometric mean is lower or equal than the arithmetic one. Many proofs/explanations exist, I'll try my version using DSP, where instead of thinking about means, we think about rolling means, which allows us to interpret them as low-pass filters. So we end up having the geometric moving average (GMA) and arithmetic moving average (SMA).
We know that GMA <= SMA, the SMA has a unity passband, this implies that the GMA has a passband lower than 1 (for non-equal input values), this explains why the GMA is smaller than the SMA. In order for a FIR filter to have a passband lower than 1, the sum of the filter coefficients must be lower than 1. In order to further proves this consider the following equation:
sqrt(a×b) = k×a + k×b
Here sqrt(a×b) is the geometric mean of a and b, the right-hand side of the equation is a weighted sum between a and b and coefficient k, we want to solve the equation with respect to k, if k×2 < 1 then we have the proof that GMA < SMA. The solution with respect to k is:
k = sqrt(a×b)/(a+b)
which always gives a number lower than 0.5, as such k×2 < 1 and thus the passband is lower than 1. If our input values are equal to each other, we end up with the following solution for k:
k = sqrt(a×a)/(a+a) = a/(2×a) = 0.5
as such the GMA has the coefficients of an SMA as long as the input values are equal to each other.
Because of this inequality, we can subtract the SMA to a GMA and take the square root of the result in order to have a volatility indicator, however, both moving averages are still pretty close to each other, which gives a very small result for the indicator.
Uwu I am a bit tired, better indicators coming up
开源脚本
秉承TradingView的精神,该脚本的作者将其开源,以便交易者可以查看和验证其功能。向作者致敬!您可以免费使用该脚本,但请记住,重新发布代码须遵守我们的网站规则。
Check out the indicators we are making at luxalgo: tradingview.com/u/LuxAlgo/
"My heart is so loud that I can't hear the fireworks"
"My heart is so loud that I can't hear the fireworks"
免责声明
这些信息和出版物并非旨在提供,也不构成TradingView提供或认可的任何形式的财务、投资、交易或其他类型的建议或推荐。请阅读使用条款了解更多信息。