OPEN-SOURCE SCRIPT
[jT] Real Candles
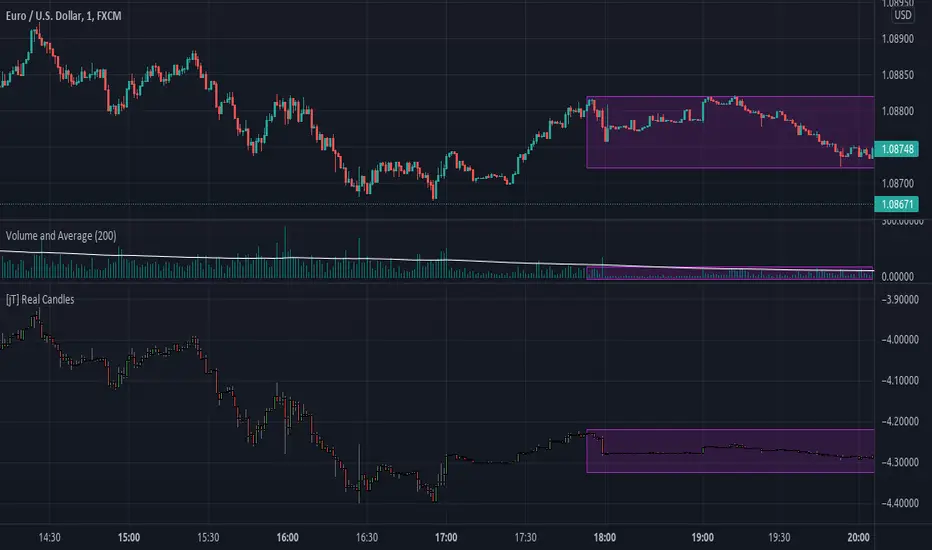
This is an "indicator" that takes the candle's size and multiply it by the current volume, so now the candle size is affected by how much volume is being traded.
Here we assume that the volume traded is essential, and now it kinda have a weight on how the price acts. So "dead-volume" areas will be almost inexpressive in the chart, while the areas with huge volume are where the volatility really happens.
Note: the purple rectangles aren't part of the script, they are just to show how a area with no volume behaves.
开源脚本
秉承TradingView的精神,该脚本的作者将其开源,以便交易者可以查看和验证其功能。向作者致敬!您可以免费使用该脚本,但请记住,重新发布代码须遵守我们的网站规则。
免责声明
这些信息和出版物并非旨在提供,也不构成TradingView提供或认可的任何形式的财务、投资、交易或其他类型的建议或推荐。请阅读使用条款了解更多信息。
开源脚本
秉承TradingView的精神,该脚本的作者将其开源,以便交易者可以查看和验证其功能。向作者致敬!您可以免费使用该脚本,但请记住,重新发布代码须遵守我们的网站规则。
免责声明
这些信息和出版物并非旨在提供,也不构成TradingView提供或认可的任何形式的财务、投资、交易或其他类型的建议或推荐。请阅读使用条款了解更多信息。