OPEN-SOURCE SCRIPT
已更新 Trend Force Histogram
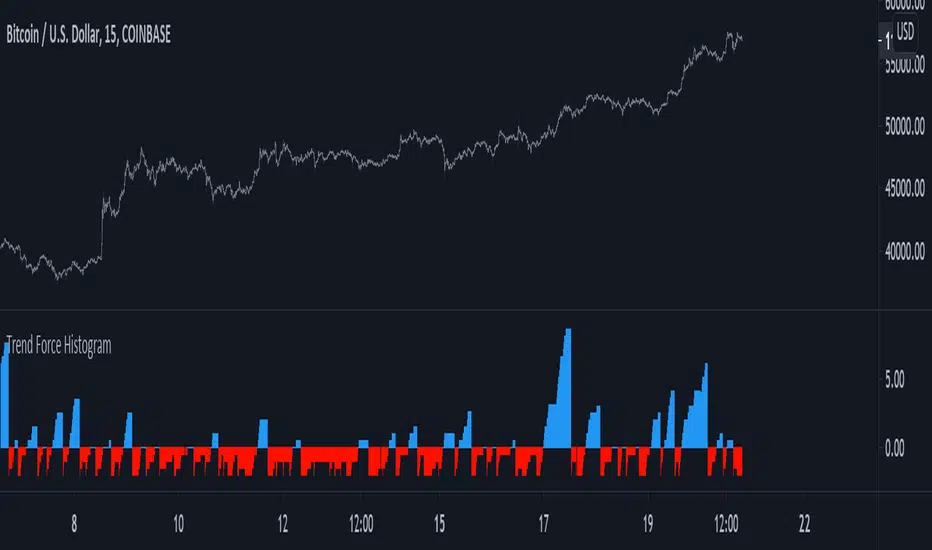
A way to see if market is trending or not trending based on highest and lowest closing price. Market is considered to be trending when the indicator is above 0 (in blue) and ranging when under 0 (in red)
Quite simple but its a way to calculate the trend force since trend can be measured thanks to highest/lowest.
Quite simple but its a way to calculate the trend force since trend can be measured thanks to highest/lowest.
版本注释
- Updated to v4- Replaced rising/falling
开源脚本
秉承TradingView的精神,该脚本的作者将其开源,以便交易者可以查看和验证其功能。向作者致敬!您可以免费使用该脚本,但请记住,重新发布代码须遵守我们的网站规则。
Check out the indicators we are making at luxalgo: tradingview.com/u/LuxAlgo/
"My heart is so loud that I can't hear the fireworks"
"My heart is so loud that I can't hear the fireworks"
免责声明
这些信息和出版物并非旨在提供,也不构成TradingView提供或认可的任何形式的财务、投资、交易或其他类型的建议或推荐。请阅读使用条款了解更多信息。