OPEN-SOURCE SCRIPT
Strongest Supports And Resistances
已更新
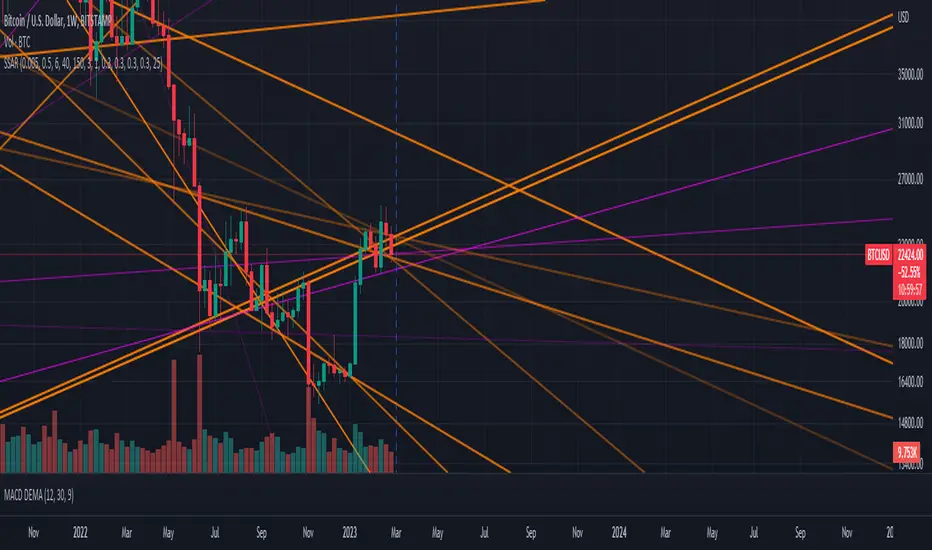
Draws the best support and resistance lines. How it works:
1) Tries every possible line through lows, highs, opens, closes
2) Finds the total hit counts given the confidence interval as input to the candlesticks
3) Calculates the strength of every line according to hit count, total volumes on hits, and timestamps
4) Eliminates similar lines, confidence interval is set as input
5) Selects the strongest 20(changable as an input) lines and draws them on the graph.
Makes your work way easier!!!
Feel free to adjust the parameters for your own style!
Cheers!!
版本注释
-Algorithm updates-Added a time input that you can ask what would be your SR lines if you didnt know the price data after time T. So you can test how well it predicts.
版本注释
-Parameter Fix版本注释
-Max non-broken streak time choice is added as power coef.开源脚本
本着真正的TradingView精神,此脚本的作者已将其开源,以便交易者可以理解和验证它。向作者致敬!您可以免费使用它,但在出版物中重复使用此代码受网站规则约束。 您可以收藏它以在图表上使用。
免责声明
这些信息和出版物并不意味着也不构成TradingView提供或认可的金融、投资、交易或其它类型的建议或背书。请在使用条款阅读更多信息。