OPEN-SOURCE SCRIPT
[MAD] Gaussian silence detector
Based on a short experiments a Gaussian silence detector
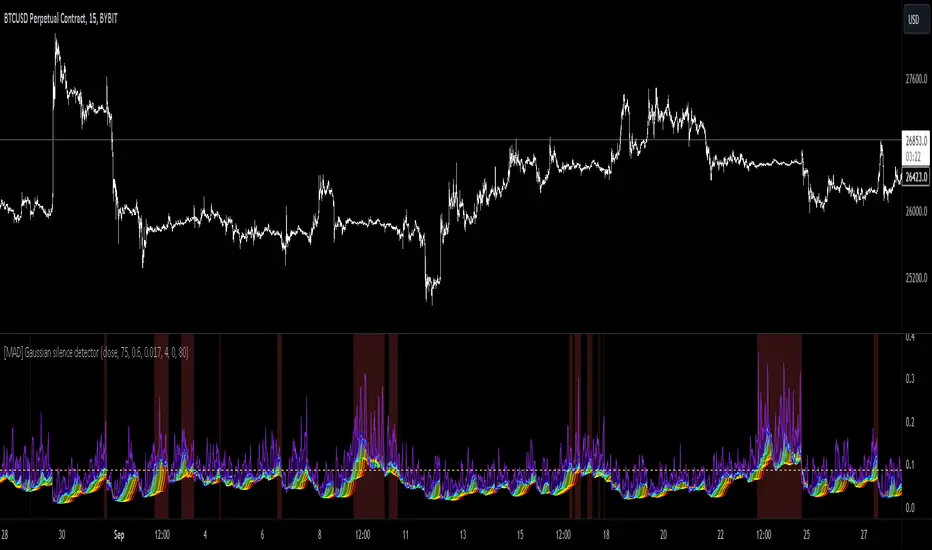
This script utilizes a Gaussian distribution function to visualize price volatility and potential major movement moments in trading.
Dynamic Spectrum Visualization:
The script plots ten different levels of the Gaussian distribution, each represented by a different color ranging from red to violet. This provides a spectrum view of the price data.
Adjustable Alert Levels:
Users can set a specific alert level, and when more than four Gaussian values exceed this threshold, a breakout alert is triggered.
Customizable Display Settings:
The visual compression, transparency, and color scheme can be adjusted to cater to different charting preferences.
Background Highlighting:
Whenever a potential breakout scenario is detected, the chart's background changes color, allowing for quick visual reference.
--------------
How to Use the Indicator
Adjust Deviation & Alert Levels:
First things first, play around with the deviation setting. This is going to help the tool understand the market's 'normal' behavior.
Next, tweak the alert levels. You want the background color to switch effectively during periods of silence. This is based on past data, so look at how the chart behaved historically and adjust accordingly.
For now each timeframe needs its own setup.
Set Up The Colors:
Once you've got the basics down, dive into the color settings. This doesn't affect how the tool works; it just makes things look prettier (or uglier, depending on your color choices 😜).
Compression (Optional):
If you think the data display is too intense or too mellow, adjust the compression. This won't change the calculations.
It's just about how you view the data.
Remember to combine it with other trading strategies and tools for the best results.
开源脚本
本着TradingView的真正精神,此脚本的创建者将其开源,以便交易者可以查看和验证其功能。向作者致敬!虽然您可以免费使用它,但请记住,重新发布代码必须遵守我们的网站规则。
免责声明
这些信息和出版物并不意味着也不构成TradingView提供或认可的金融、投资、交易或其它类型的建议或背书。请在使用条款阅读更多信息。
免责声明
这些信息和出版物并不意味着也不构成TradingView提供或认可的金融、投资、交易或其它类型的建议或背书。请在使用条款阅读更多信息。