OPEN-SOURCE SCRIPT
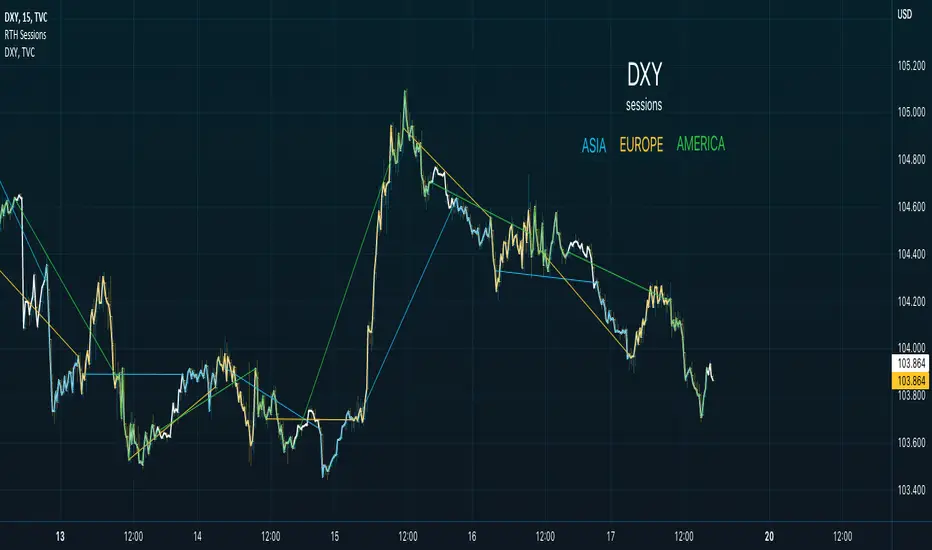
Regular Trading Hour Sessions for America, Asia and EU

This trading view script is a simple one but I find it very helpful in spotting changes in trend of FX.
The basic idea is to create a visual direction from the previous session to the next new session.
The concept while basic provides visual trend direction and changes as session change.
The three sessions are:
1. Asia from 2130-0400
2. Europe from 0300-1130
3. America from 0930-1600
When you use a line chart you will see the default line when no sessions are active.
Features I plan to add
* Tracking delta of each session
* Moving Averages of each session
* Momentum of each session
* Delta difference
My ultimate goal for this script will be to provide a way to visualize the impact of each session and provide data to buy/sell triggers for Trading Strategies.
Please provide feedback and if you use the script or add a feature please update me or send me the feature to add to the script.
开源脚本
秉承TradingView的精神,该脚本的作者将其开源,以便交易者可以查看和验证其功能。向作者致敬!您可以免费使用该脚本,但请记住,重新发布代码须遵守我们的网站规则。
免责声明
这些信息和出版物并非旨在提供,也不构成TradingView提供或认可的任何形式的财务、投资、交易或其他类型的建议或推荐。请阅读使用条款了解更多信息。
开源脚本
秉承TradingView的精神,该脚本的作者将其开源,以便交易者可以查看和验证其功能。向作者致敬!您可以免费使用该脚本,但请记住,重新发布代码须遵守我们的网站规则。
免责声明
这些信息和出版物并非旨在提供,也不构成TradingView提供或认可的任何形式的财务、投资、交易或其他类型的建议或推荐。请阅读使用条款了解更多信息。