OPEN-SOURCE SCRIPT
已更新 Vol (Wyckoff)
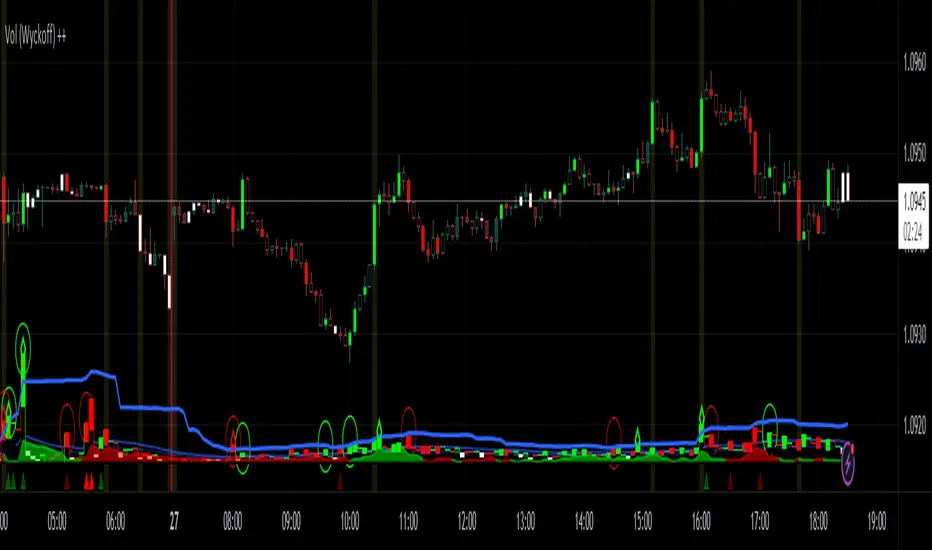
I like TradingView Built-in Volume indicator, because it is overlay with price chart, and has appropriate scale.
I made similar style volume indicator and added concept of Laws of Wyckoff.
caution : You need {Chart settings} → {Appearance} → {Bottom margin} is set 0 %, to make chart look good.
: You need {Chart settings} → {Symbol} → {body} ,{Borders} and {Wick} are set dark color, to easier to identify the color of candles.
This 3 Laws of Wyckoff are my interpretation, not the original.
///////// The Law of Supply and Demand //////////
I define the Demand as volume that is larger than the previous volume and has close > open bar.
I define the Supply as volume that is larger than the previous volume and has close <= open bar.
Volume Flow is value difference between Demand MA and Supply MA.
I imitate the idea of "Volume Flow v3" by oh92.

///////// The Law of Cause and Effect //////////
Enough volume(Cause) makes reliable price movement(Effect).
If there is not enough volume, its price movement is suspicious.
I define enough volume as volume that is larger than previous volume.
I define large volume as volume that is larger than previous volume and over volume MA(using all volume).
I define "not enough volume" as volume that is smaller than previous volume.
I borrowed the idea from "The Lie Detector" by LucF.
Enough volume(increasing volume) is painted by dark color and Large volume(increasing volume and over volume MA) is painted by light color.
"Not enough volume"(decreasing volume) is painted by empty color(default is black).
This coloring are reflected to price candles.
So, you need {Chart settings} → {Symbol} → {body} ,{Borders} and {Wick} are set dark color, to easier to identify the color of candles.

///////// The Law of Effort and Result //////////
If volume (effort) cannot move price (result), it may be Absorption(potential reversal).
"Factor of Volume Density" determines the threshold of Absorption.
Small Absorption is displayed by gray square at bottom.
Large Absorption is displayed by white square at bottom.

///////// Volume Spike //////////
Volume Spike sometimes precede or confirm trend direction.
"Factor of Volume Spike" determines the threshold of Volume Spike.
Volume Spike is displayed by light bulb.

I made similar style volume indicator and added concept of Laws of Wyckoff.
caution : You need {Chart settings} → {Appearance} → {Bottom margin} is set 0 %, to make chart look good.
: You need {Chart settings} → {Symbol} → {body} ,{Borders} and {Wick} are set dark color, to easier to identify the color of candles.
This 3 Laws of Wyckoff are my interpretation, not the original.
///////// The Law of Supply and Demand //////////
I define the Demand as volume that is larger than the previous volume and has close > open bar.
I define the Supply as volume that is larger than the previous volume and has close <= open bar.
Volume Flow is value difference between Demand MA and Supply MA.
I imitate the idea of "Volume Flow v3" by oh92.
///////// The Law of Cause and Effect //////////
Enough volume(Cause) makes reliable price movement(Effect).
If there is not enough volume, its price movement is suspicious.
I define enough volume as volume that is larger than previous volume.
I define large volume as volume that is larger than previous volume and over volume MA(using all volume).
I define "not enough volume" as volume that is smaller than previous volume.
I borrowed the idea from "The Lie Detector" by LucF.
Enough volume(increasing volume) is painted by dark color and Large volume(increasing volume and over volume MA) is painted by light color.
"Not enough volume"(decreasing volume) is painted by empty color(default is black).
This coloring are reflected to price candles.
So, you need {Chart settings} → {Symbol} → {body} ,{Borders} and {Wick} are set dark color, to easier to identify the color of candles.
///////// The Law of Effort and Result //////////
If volume (effort) cannot move price (result), it may be Absorption(potential reversal).
"Factor of Volume Density" determines the threshold of Absorption.
Small Absorption is displayed by gray square at bottom.
Large Absorption is displayed by white square at bottom.
///////// Volume Spike //////////
Volume Spike sometimes precede or confirm trend direction.
"Factor of Volume Spike" determines the threshold of Volume Spike.
Volume Spike is displayed by light bulb.
版本注释
fixed spell mistake.版本注释
If You want to use this script as normal style(separated pane), right click this indicator and "Move to" New pane below, and then turn off "Scale Adjustment" from this indicator's settings{Style}.
版本注释
added No Demand / Supply candle and TR Spike.版本注释
Major update !!开源脚本
秉承TradingView的精神,该脚本的作者将其开源,以便交易者可以查看和验证其功能。向作者致敬!您可以免费使用该脚本,但请记住,重新发布代码须遵守我们的网站规则。
免责声明
这些信息和出版物并非旨在提供,也不构成TradingView提供或认可的任何形式的财务、投资、交易或其他类型的建议或推荐。请阅读使用条款了解更多信息。
免责声明
这些信息和出版物并非旨在提供,也不构成TradingView提供或认可的任何形式的财务、投资、交易或其他类型的建议或推荐。请阅读使用条款了解更多信息。