PROTECTED SOURCE SCRIPT
VXN (NQ100 VIX) Implied Move Bands for NQ futures.
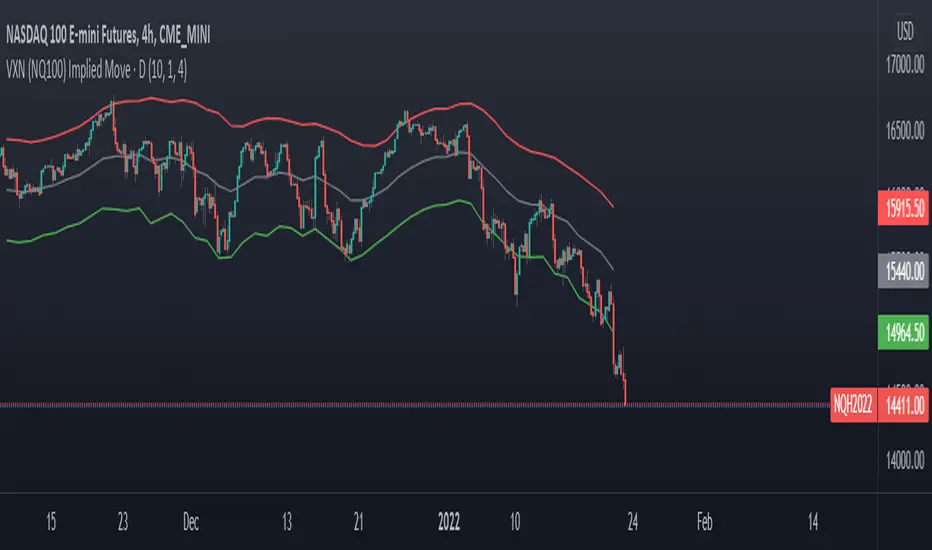
A spin-off of my similar script for ES futures. This script uses the VXN Index instead of the VIX, which represents the 30-day implied volatility of Nasdaq-100 options and then uses that value to plot bands on the chart, helping traders identify price extremes as identified by the options market. Users can modify the moving average, bands multiplier, and number of lookback days used in the calculation to suit their trading style.
受保护脚本
此脚本以闭源形式发布。 但是,您可以自由使用它,没有任何限制 — 在此处了解更多信息。
免责声明
这些信息和出版物并不意味着也不构成TradingView提供或认可的金融、投资、交易或其它类型的建议或背书。请在使用条款阅读更多信息。
免责声明
这些信息和出版物并不意味着也不构成TradingView提供或认可的金融、投资、交易或其它类型的建议或背书。请在使用条款阅读更多信息。