OPEN-SOURCE SCRIPT
Earnings Beat Indicator
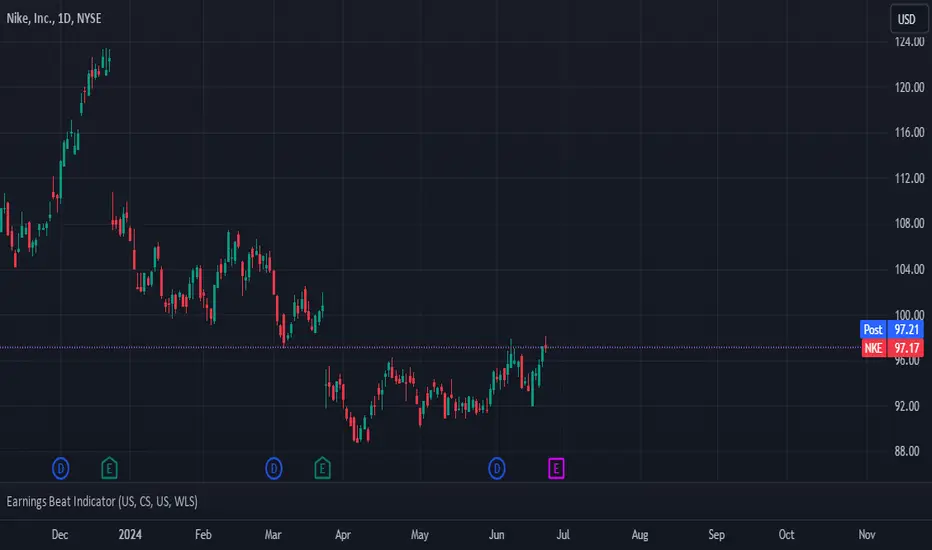
This indicator seeks to predict whether a stock will beat or miss earnings by forecasting revenues, and subsequently net income, using linear regression. The y-values of this regression are revenues and the x-axis is an economic series of your choosing. Double-click the status line (the words "US" and "GDP") to change economic datasets. The full list of economic datasets available in TradingView is in the Help Center.
Instructions:
1. Double-click on the status line (the fields "US" and "GDP"). The inputs tab will pop up.
2. Type in the country and data codes for the economic datasets you believe have the highest correlation with revenues and net margins respectively.
3. Check the correlation coefficient between financial data and economic data by interpreting the white and gray numbers on the status line - white for the correlation coefficient between revenues and your chosen economic dataset, and gray for the correlation coefficient between net margins and your chosen economic dataset. These numbers should be as close to +1 or -1 as possible.
4. Interpret the results - the blue number indicates whether revenues will beat estimates and the green number indicates whether earnings will beat estimates. A 1 for both outputs indicates a double beat, a 1 and a 0 indicates a revenue beat but not an earnings beat, a 0 and a 1 indicates an earnings beat but not a revenue beat, and a 0 and a 0 indicates a double miss.
- DickZhones
开源脚本
秉承TradingView的精神,该脚本的作者将其开源,以便交易者可以查看和验证其功能。向作者致敬!您可以免费使用该脚本,但请记住,重新发布代码须遵守我们的网站规则。
免责声明
这些信息和出版物并非旨在提供,也不构成TradingView提供或认可的任何形式的财务、投资、交易或其他类型的建议或推荐。请阅读使用条款了解更多信息。
免责声明
这些信息和出版物并非旨在提供,也不构成TradingView提供或认可的任何形式的财务、投资、交易或其他类型的建议或推荐。请阅读使用条款了解更多信息。