OPEN-SOURCE SCRIPT
已更新 The Rush
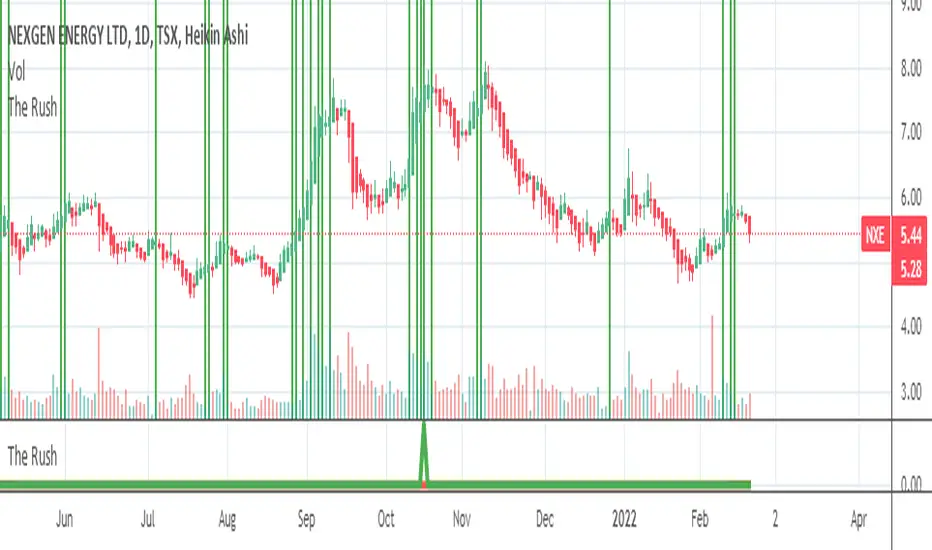
█ OVERVIEW
This script shows when buyers are in a rush to buy and when sellers are in a rush to sell
═════════════════════════════════════════════════════════════════════════
█ CONCEPTS
Prophet Mohamed Peace be upon Him once said something similar to this "It is not advisable to trade if you do not know the
Volume".
In his book "The Day Trader's Bible - Or My Secret In Day trading Of Stocks", Richard D. Kickoff wrote in page 55
"This shows that there was only 100 shares for sale at 180 1/8, none at all at 180f^, and only 500 at 3/8. The jump from 1 to 8 to 3/8
Emphasizes both the absence of pressure and persistency on the part of the buyers. They are not content to wait patiently until they can
Secure the stock at 180^/4; they "reach" for it."
This script was inspired by these two great men.
Prophet Mohamed Peace be upon Him showed the importance of the volume and Richard D. Kickoff explained what Prophet
Mohamed Peace be upon Him meant.
So I created this script that gauge the movement of the stock and the sentiments of the traders.
═════════════════════════════════════════════════════════════════════════
• FEATURES: The script calculates The Percentage Difference of the price and The Percentage Difference of the volume between
two success bullish candles (or two success bearish candles) and then it creates a ratio between these two Percentage
Differences and in the end the ratio is compared to the previous one to see if there is an increase or a decrease.
═════════════════════════════════════════════════════════════════════════
• HOW TO USE: if you see 2 or more successive red bars that mean bears are in hurry to sell and you can expect a bearish trend soon
if the Market Maker allows it or later if the Market Maker wants to do some distribution.
if you see 2 or more successive green bars that mean bulls are in hurry to buy and you can expect a bullish trend soon if the Market
Maker allows it or later if the Market Maker wants to do some accumulation.
═════════════════════════════════════════════════════════════════════════
• LIMITATIONS:
1- Use only Heikin Ashi chart
2- Good only if volume data is correct , meaning good for a centralized Market. (You can use it for forex or
crypto but at your own risk because those markets are not centralized)
═════════════════════════════════════════════════════════════════════════
• THANKS: I pay homage to Prophet Mohamed Peace be upon Him and Richard D. Kickoff who inspired the creation of this
Script.
═════════════════════════════════════════════════════════════════════════
版本注释
Typo mistake Richard D. Kickoff is Richard D. Wyckoff a great trader版本注释
Elimination of the small signals 版本注释
1- Regular Bar candle can be also be used • HOW TO USE: if you see red line of value equal -75 or less that mean bears are in hurry to sell and you can expect a bearish trend soon
if the Market Maker allows it or later if the Market Maker wants to do some distribution.
if you see green line of value equal 75 or more that mean bulls are in hurry to buy and you can expect a bullish trend soon if the Market
Maker allows it or later if the Market Maker wants to do some accumulation.
版本注释
1- Regular Bar candle chart can be also be used with some time frames otherwise use Heikin Ashi chart版本注释
the modification that was made to eliminate weak signals was not appreciated so here is the original version开源脚本
秉承TradingView的精神,该脚本的作者将其开源,以便交易者可以查看和验证其功能。向作者致敬!您可以免费使用该脚本,但请记住,重新发布代码须遵守我们的网站规则。
免责声明
这些信息和出版物并非旨在提供,也不构成TradingView提供或认可的任何形式的财务、投资、交易或其他类型的建议或推荐。请阅读使用条款了解更多信息。
免责声明
这些信息和出版物并非旨在提供,也不构成TradingView提供或认可的任何形式的财务、投资、交易或其他类型的建议或推荐。请阅读使用条款了解更多信息。