OPEN-SOURCE SCRIPT
已更新 Macro Timeframes with Opening Price
Description: Macro Timeframe Horizontal Line Indicator
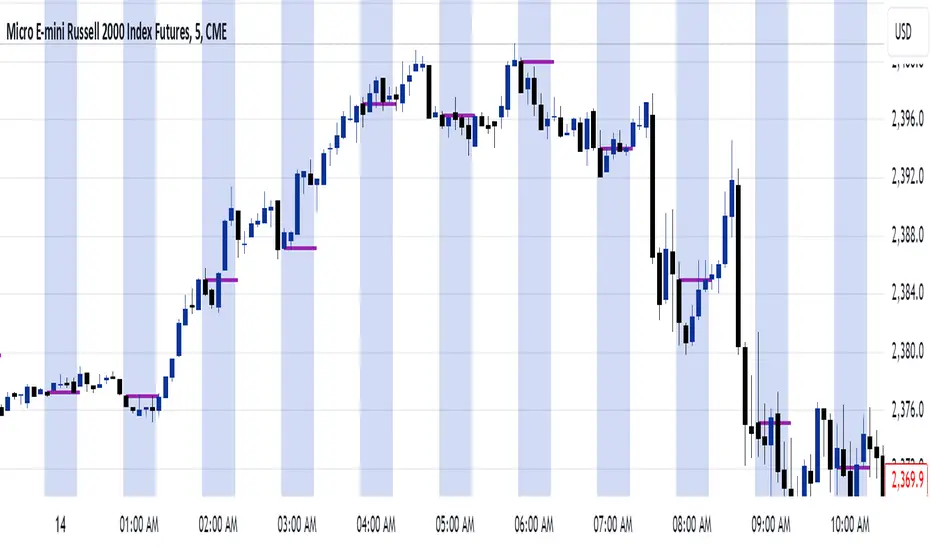
This indicator highlights macro periods on the chart by drawing a horizontal line at the opening price of each macro period. The macro timeframe is defined as the last 10 minutes of an hour (from :50 to :00) and the first 10 minutes of the following hour (from :00 to :10).
A horizontal black line is plotted at the opening price of the macro period, starting at :50 and extending through the duration of the macro window. However, you can customize it however you see fit.
The background of the macro period is highlighted with a customizable color to visually distinguish the timeframe.
The horizontal line updates at each macro period, ensuring that the opening price for every macro session is accurately reflected on the chart.
This tool is useful for traders who want to track the behavior of price within key macro intervals and visually assess price movement and volatility during these periods.
版本注释
This script highlights macro periods on the chart and draws a line representing the open of the macro.The background highlight is visible on the chart when the timeframe is 15 mins or less.
The length of the macros opening price is also adjusted so it is variable with the timeframe. Shorter lengths for the higher timeframes while longer lengths for the lower timeframes.
版本注释
I adjusted the length again to account for the timeframes <1 minute版本注释
Added in the ability to change the color and thickness of the line of the MOP.开源脚本
秉承TradingView的精神,该脚本的作者将其开源,以便交易者可以查看和验证其功能。向作者致敬!您可以免费使用该脚本,但请记住,重新发布代码须遵守我们的网站规则。
免责声明
这些信息和出版物并非旨在提供,也不构成TradingView提供或认可的任何形式的财务、投资、交易或其他类型的建议或推荐。请阅读使用条款了解更多信息。
开源脚本
秉承TradingView的精神,该脚本的作者将其开源,以便交易者可以查看和验证其功能。向作者致敬!您可以免费使用该脚本,但请记住,重新发布代码须遵守我们的网站规则。
免责声明
这些信息和出版物并非旨在提供,也不构成TradingView提供或认可的任何形式的财务、投资、交易或其他类型的建议或推荐。请阅读使用条款了解更多信息。