PROTECTED SOURCE SCRIPT
已更新 Vasyl Ivanov | FVG, imbalance
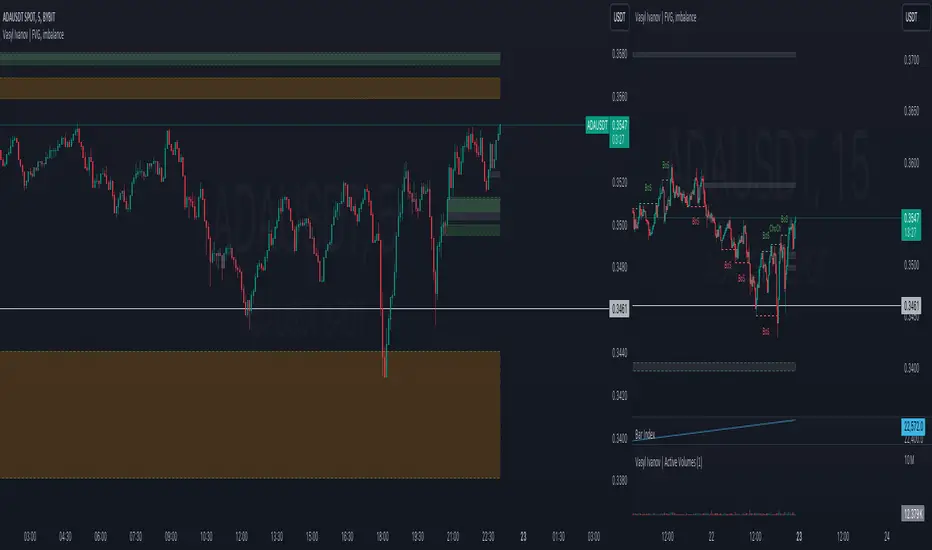
Fair Value Gap (FVG) / Imbalance Indicator
This indicator is specifically designed to help traders detect Fair Value Gaps (FVG) and Imbalance in the market, highlighting key areas where price action may return to "fill the gap" or restore balance. Additionally, it detects strong FVG scenarios, where Break of Structure (BoS) intersects with an FVG, giving traders an extra level of insight.
Key Features:
How It Works:
The FVG / Imbalance Indicator scans price action for gaps where price moves too quickly, leaving areas of imbalance:
Use Cases:
Why It’s Unique:
This indicator goes beyond basic FVG and imbalance detection by introducing Strong FVGs, offering traders an advanced tool to identify crucial market zones where structural changes and gaps intersect. The distinct color for Strong FVGs ensures traders don’t miss these high-impact areas.
This indicator is specifically designed to help traders detect Fair Value Gaps (FVG) and Imbalance in the market, highlighting key areas where price action may return to "fill the gap" or restore balance. Additionally, it detects strong FVG scenarios, where Break of Structure (BoS) intersects with an FVG, giving traders an extra level of insight.
Key Features:
- Fair Value Gap (FVG) Detection:
The indicator identifies FVGs, which occur when the price leaves an unfilled gap between two bars. These gaps often act as key price targets for future market action, providing potential entry or exit points. - Imbalance Detection:
Imbalances occur when there is a discrepancy between buying and selling pressure, leaving price gaps that the market often seeks to fill. This feature highlights these imbalances on the chart. - Strong FVG Highlighting:
A Strong FVG is marked when there’s an intersection between a Break of Structure (BoS) and an FVG. This situation is highlighted with a distinct color, drawing attention to areas of higher importance where both a BoS and FVG are present, signaling potential significant price moves.
How It Works:
The FVG / Imbalance Indicator scans price action for gaps where price moves too quickly, leaving areas of imbalance:
- Fair Value Gaps (FVG) are detected when price leaves a gap, signaling potential levels where the price may retrace.
- Imbalance is identified when buying and selling pressure is uneven, leading to unfilled gaps in price action.
- Strong FVG detection combines FVG with BoS, highlighting critical zones where price is likely to react significantly due to a structural shift and a gap in price action.
Use Cases:
- Gap Trading: Use the FVG indicator to identify potential levels where the market may return to fill the gap, offering valuable entry and exit points.
- Detecting Imbalance: Spot areas of price imbalance, which can act as magnets for price retracements.
- Key Reversal Zones: Strong FVGs highlight potential reversal or continuation points where both a BoS and FVG intersect, making these zones crucial for high-probability trading opportunities.
Why It’s Unique:
This indicator goes beyond basic FVG and imbalance detection by introducing Strong FVGs, offering traders an advanced tool to identify crucial market zones where structural changes and gaps intersect. The distinct color for Strong FVGs ensures traders don’t miss these high-impact areas.
版本注释
Added multi-timeframe support. Build FVGs on up to 4 timeframes on the same chart版本注释
Changed default values for easier start版本注释
Improved multi-timeframe calculations for long periods版本注释
Added option 'Remove overlapped FVG'版本注释
Improved the BoS detection algorithm based on the new Extremums detection.版本注释
Fixed a bug for historical bars版本注释
Added Internal BoS option版本注释
Improved distance on which to hide FVG's版本注释
Improved another script issue版本注释
Optimized calculations版本注释
Prevent calculations out of barstate.isconfirmed版本注释
Improved extremums detection版本注释
One more fix for extremums detection版本注释
improved searching of a first extremum受保护脚本
此脚本以闭源形式发布。 但是,您可以自由使用,没有任何限制 — 了解更多信息这里。
免责声明
这些信息和出版物并非旨在提供,也不构成TradingView提供或认可的任何形式的财务、投资、交易或其他类型的建议或推荐。请阅读使用条款了解更多信息。
受保护脚本
此脚本以闭源形式发布。 但是,您可以自由使用,没有任何限制 — 了解更多信息这里。
免责声明
这些信息和出版物并非旨在提供,也不构成TradingView提供或认可的任何形式的财务、投资、交易或其他类型的建议或推荐。请阅读使用条款了解更多信息。