OPEN-SOURCE SCRIPT
Anomaly Detector
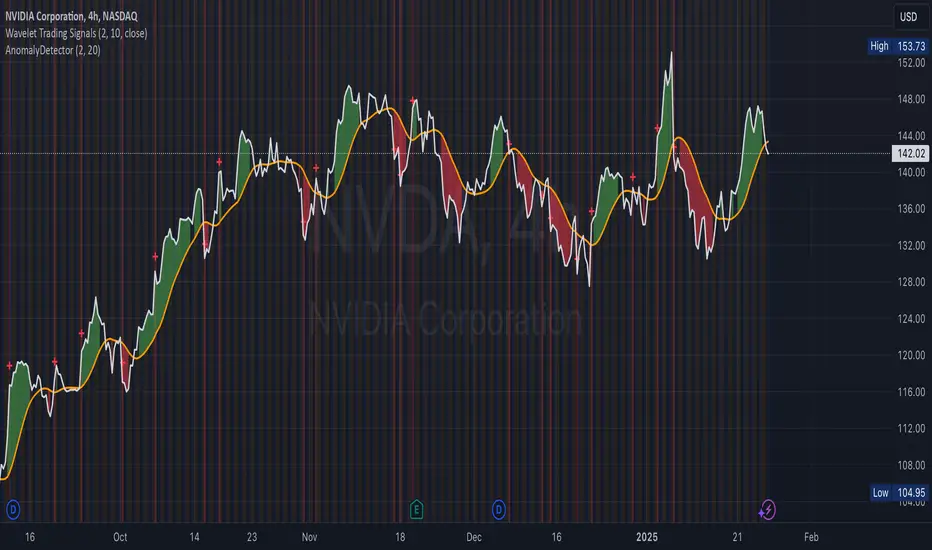
Price Anomaly Detector
This is a script designed to identify unusual price movements. By analyzing deviations from typical price behavior, this tool helps traders spot potential trading opportunities and manage risks effectively.
---
Features
- Anomaly Detection: Flags price points that significantly deviate from the average.
- Visual Indicators: Highlights anomalies with background colors and cross markers.
- Customizable Settings: Adjust sensitivity and window size to match your trading strategy.
- Real-Time Analysis: Continuously updates anomaly signals as new data is received.
---
Usage
After adding the indicator to your chart:
1. View Anomalies: Red backgrounds and cross markers indicate detected anomalies.
2. Adjust Settings: Modify the `StdDev Threshold` and `Window Length` to change detection sensitivity.
3. Interpret Signals:
- Red Background: Anomaly detected on that bar.
- Red Cross: Specific point of anomaly.
---
Inputs
- StdDev Threshold: Higher values reduce anomaly sensitivity. Default: 2.0.
- Window Length: Larger windows smooth data, reducing false positives. Default: 20.
---
Limitations
- Approximation Method: Uses a simple method to detect anomalies, which may not capture all types of unusual price movements.
- Performance: Extremely large window sizes may impact script performance.
- Segment Detection: Does not group consecutive anomalies into segments.
---
Disclaimer: This tool is for educational purposes only. Trading involves risk, and you should perform your own analysis before making decisions. The author is not liable for any losses incurred.
开源脚本
秉承TradingView的精神,该脚本的作者将其开源,以便交易者可以查看和验证其功能。向作者致敬!您可以免费使用该脚本,但请记住,重新发布代码须遵守我们的网站规则。
免责声明
这些信息和出版物并非旨在提供,也不构成TradingView提供或认可的任何形式的财务、投资、交易或其他类型的建议或推荐。请阅读使用条款了解更多信息。
开源脚本
秉承TradingView的精神,该脚本的作者将其开源,以便交易者可以查看和验证其功能。向作者致敬!您可以免费使用该脚本,但请记住,重新发布代码须遵守我们的网站规则。
免责声明
这些信息和出版物并非旨在提供,也不构成TradingView提供或认可的任何形式的财务、投资、交易或其他类型的建议或推荐。请阅读使用条款了解更多信息。