OPEN-SOURCE SCRIPT
已更新 Relative Volume
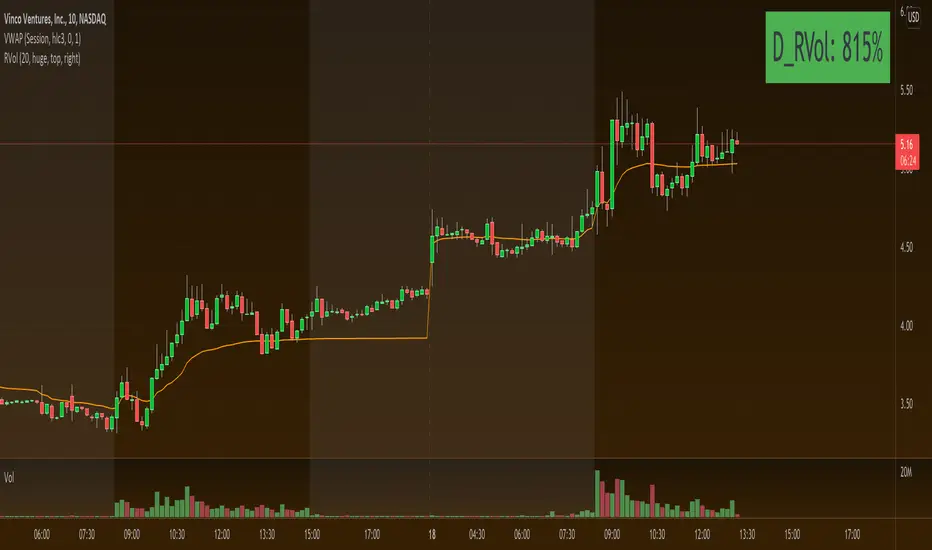
Relative Volume label in percent. So 400% RVol means, today's volume is 4x compared to avg volume for the length you selected.
版本注释
There was a mis-calculation on the script where if you change chart resolution, the RVol changes. But the intention of this script is, RVol should be same for the day whether you're on 1Hr chart or 3min chart or Daily chart. RVol is measured on daily basis to compare past N number of days. 版本注释
Couple of features added:1. When chart resolution is Daily or Intraday (D, 4H, 1H, 5min, etc), Relative Volume shows value based on DAILY.
2. When resolution is changed to Weekly or Monthly, then Relative Volume shows corresponding value. i.e. Weekly shows weekly relative volume of this week compared to past 'N' weeks. Likewise for Monthly. You would see change in label name. Like, Weekly chart shows W_RVol (Weekly Relative Volume). Likewise, Daily & Intraday shows D_RVol. Monthly shows M_RVol (Monthly Relative Volume).
3. Added a plot (by default hidden) for this specific reason: When you move the cursor to focus specific candle, then Indicator Value displays relative volume of that specific candle. This applies to Intraday as well. So if you're in 1HR chart and move the cursor to a specific candle, Indicator Value shows relative volume for that specific candlestick bar.
Hope you find this useful.
版本注释
Updating the script so that text size and location can be customized. 开源脚本
秉承TradingView的精神,该脚本的作者将其开源,以便交易者可以查看和验证其功能。向作者致敬!您可以免费使用该脚本,但请记住,重新发布代码须遵守我们的网站规则。
免责声明
这些信息和出版物并非旨在提供,也不构成TradingView提供或认可的任何形式的财务、投资、交易或其他类型的建议或推荐。请阅读使用条款了解更多信息。
免责声明
这些信息和出版物并非旨在提供,也不构成TradingView提供或认可的任何形式的财务、投资、交易或其他类型的建议或推荐。请阅读使用条款了解更多信息。