OPEN-SOURCE SCRIPT
WMA Bands
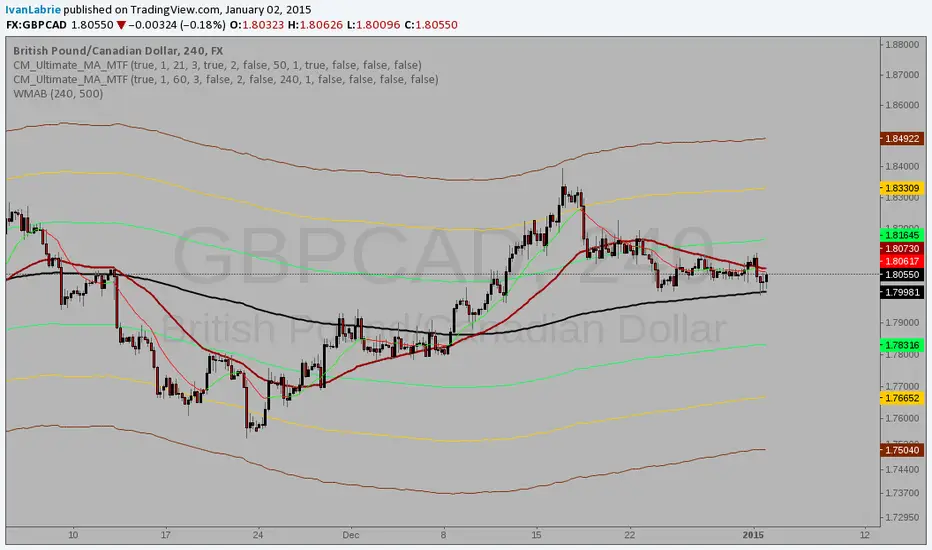
In this chart we can see an adaptation I made of an indicator a certain fellow named nanningbob uses in one of his trading systems.
It's a great thing to have, since Forex pairs are mostly ranging markets. It captures price movement very well, and gives realistic take profit levels, without having to risk major drawdown if used wisely.
Hope you like it and find it useful.
*Props to ucsgears for the original code I modified.
It's a great thing to have, since Forex pairs are mostly ranging markets. It captures price movement very well, and gives realistic take profit levels, without having to risk major drawdown if used wisely.
Hope you like it and find it useful.
*Props to ucsgears for the original code I modified.
开源脚本
秉承TradingView的精神,该脚本的作者将其开源,以便交易者可以查看和验证其功能。向作者致敬!您可以免费使用该脚本,但请记住,重新发布代码须遵守我们的网站规则。
免责声明
这些信息和出版物并非旨在提供,也不构成TradingView提供或认可的任何形式的财务、投资、交易或其他类型的建议或推荐。请阅读使用条款了解更多信息。
开源脚本
秉承TradingView的精神,该脚本的作者将其开源,以便交易者可以查看和验证其功能。向作者致敬!您可以免费使用该脚本,但请记住,重新发布代码须遵守我们的网站规则。
免责声明
这些信息和出版物并非旨在提供,也不构成TradingView提供或认可的任何形式的财务、投资、交易或其他类型的建议或推荐。请阅读使用条款了解更多信息。