OPEN-SOURCE SCRIPT
KT HMA
Overview :
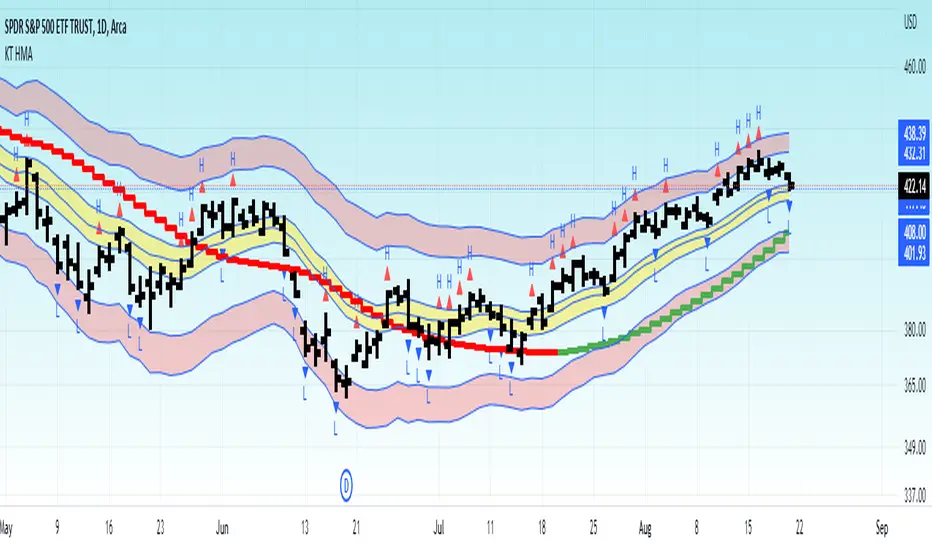
This indicator is an experiment to combine one of the volatility concepts (ATR), weighted MA and price movements to help visualize current market condition.
Red Band : ATR volatility bands with 2nd and 3rd standard deviation.
Yellow Band : Moving Average band
HMA : Green/Red >> Shows current trend. Using HMA to emphasize on recent price points rather than older one.
-----------------
Disclaimer
My Scripts/Indicators/Ideas/Systems including above ones are only for educational purposes. The information contained in the Scripts/Indicators/Ideas does not constitute financial advice or a solicitation to buy or sell any securities of any type. All investments involve risk, and the past performance of a security, industry, sector, market, financial product, trading strategy, backtest, or individual's trading does not guarantee future results or returns. Do not trade with capital that you can not afford to lose. Investors are fully responsible for any investment decisions they make. Such decisions should be based solely on an evaluation of their financial circumstances, investment objectives, risk tolerance, and liquidity needs.
开源脚本
秉承TradingView的精神,该脚本的作者将其开源,以便交易者可以查看和验证其功能。向作者致敬!您可以免费使用该脚本,但请记住,重新发布代码须遵守我们的网站规则。
免责声明
这些信息和出版物并非旨在提供,也不构成TradingView提供或认可的任何形式的财务、投资、交易或其他类型的建议或推荐。请阅读使用条款了解更多信息。
免责声明
这些信息和出版物并非旨在提供,也不构成TradingView提供或认可的任何形式的财务、投资、交易或其他类型的建议或推荐。请阅读使用条款了解更多信息。