OPEN-SOURCE SCRIPT
VixFix RVol + EMA
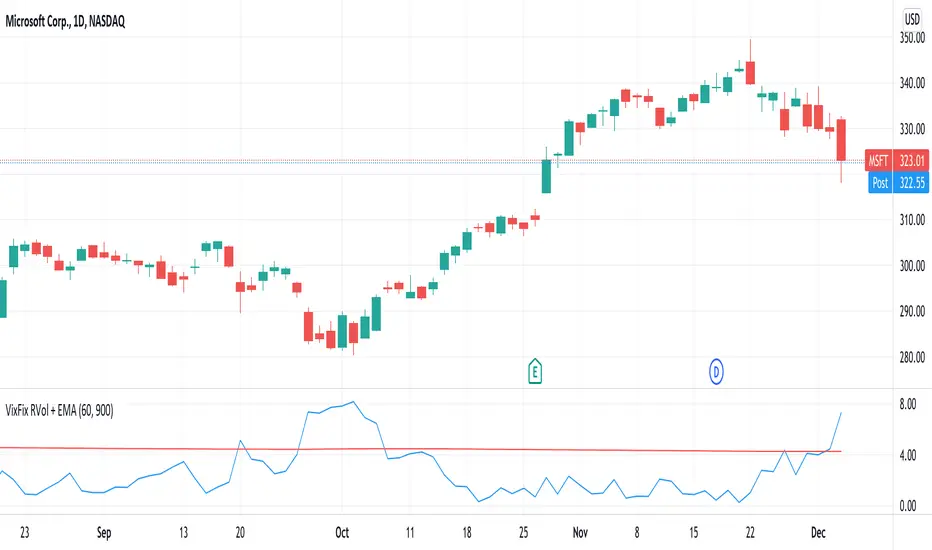
This indicator plots Realised Volatility (measured using VixFix method) against its long-term exponential moving average.
RVol breaking above its EMA = Sell signal
RVol breaking below its EMA = Buy signal
60-day VixFix look back period and 900 day EMA work well for lower volatility tickers (equity ETFs, megacap stocks). Higher volatility tickers could benefit from shorter look back period and EMA.
RVol breaking above its EMA = Sell signal
RVol breaking below its EMA = Buy signal
60-day VixFix look back period and 900 day EMA work well for lower volatility tickers (equity ETFs, megacap stocks). Higher volatility tickers could benefit from shorter look back period and EMA.
开源脚本
秉承TradingView的精神,该脚本的作者将其开源,以便交易者可以查看和验证其功能。向作者致敬!您可以免费使用该脚本,但请记住,重新发布代码须遵守我们的网站规则。
免责声明
这些信息和出版物并非旨在提供,也不构成TradingView提供或认可的任何形式的财务、投资、交易或其他类型的建议或推荐。请阅读使用条款了解更多信息。
开源脚本
秉承TradingView的精神,该脚本的作者将其开源,以便交易者可以查看和验证其功能。向作者致敬!您可以免费使用该脚本,但请记住,重新发布代码须遵守我们的网站规则。
免责声明
这些信息和出版物并非旨在提供,也不构成TradingView提供或认可的任何形式的财务、投资、交易或其他类型的建议或推荐。请阅读使用条款了解更多信息。