OPEN-SOURCE SCRIPT
已更新 Good Signal Indicator
Description:
The Good Signal Indicator utilizes Exponential Moving Averages (EMA) across multiple timeframes to provide buy or sell signals based on the relative positioning of short-term and long-term EMAs.
Features:
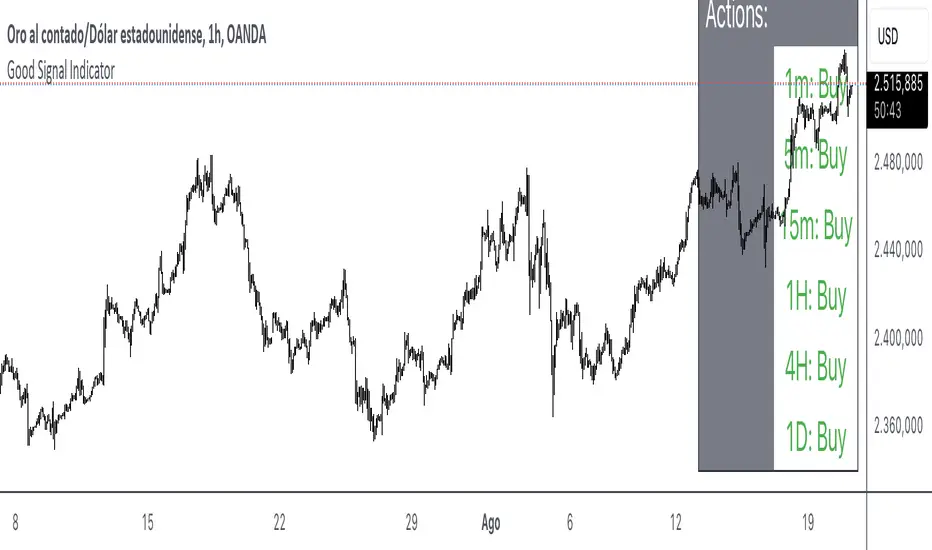
Multiple Timeframes: Includes EMAs for 1 minute, 5 minutes, 15 minutes, 1 hour, 4 hours, and 1 day.
Customizable Settings: Allows for the configuration of EMA lengths (20 and 50 periods).
Clear Signals: Displays buy, sell, or neutral signals on a table for each timeframe.
How It Works:
EMA Calculation: Computes the EMA values for specified lengths and timeframes.
Signal Generation: Determines buy and sell signals based on whether the current EMA is above or below the EMA from 30 bars ago.
Table Display: Presents the signals in a table at the bottom-right of the chart, showing whether to buy, sell, or hold for each timeframe.
Usage Instructions:
Apply the Indicator: Add the script to your TradingView chart.
Review Signals: Observe the table to understand the current trend for each timeframe.
Adjust Settings: Customize the EMA lengths if needed to fit your trading strategy.
Example Chart:
Ensure your chart is clean, showing only the indicator table without additional clutter. The table should clearly reflect the current buy, sell, or neutral status based on the EMA calculations.
Disclaimer: This indicator is a tool for analysis and should be used in conjunction with other indicators and market research. Always test with historical data before applying it to live trading.
The Good Signal Indicator utilizes Exponential Moving Averages (EMA) across multiple timeframes to provide buy or sell signals based on the relative positioning of short-term and long-term EMAs.
Features:
Multiple Timeframes: Includes EMAs for 1 minute, 5 minutes, 15 minutes, 1 hour, 4 hours, and 1 day.
Customizable Settings: Allows for the configuration of EMA lengths (20 and 50 periods).
Clear Signals: Displays buy, sell, or neutral signals on a table for each timeframe.
How It Works:
EMA Calculation: Computes the EMA values for specified lengths and timeframes.
Signal Generation: Determines buy and sell signals based on whether the current EMA is above or below the EMA from 30 bars ago.
Table Display: Presents the signals in a table at the bottom-right of the chart, showing whether to buy, sell, or hold for each timeframe.
Usage Instructions:
Apply the Indicator: Add the script to your TradingView chart.
Review Signals: Observe the table to understand the current trend for each timeframe.
Adjust Settings: Customize the EMA lengths if needed to fit your trading strategy.
Example Chart:
Ensure your chart is clean, showing only the indicator table without additional clutter. The table should clearly reflect the current buy, sell, or neutral status based on the EMA calculations.
Disclaimer: This indicator is a tool for analysis and should be used in conjunction with other indicators and market research. Always test with historical data before applying it to live trading.
版本注释
Description:The Good Signal Indicator utilizes Exponential Moving Averages (EMA) across multiple timeframes to provide buy or sell signals based on the relative positioning of short-term and long-term EMAs.
Features:
Multiple Timeframes: Includes EMAs for 1 minute, 5 minutes, 15 minutes, 1 hour, 4 hours, and 1 day.
Customizable Settings: Allows for the configuration of EMA lengths (20 and 50 periods).
Clear Signals: Displays buy, sell, or neutral signals on a table for each timeframe.
How It Works:
EMA Calculation: Computes the EMA values for specified lengths and timeframes.
Signal Generation: Determines buy and sell signals based on whether the current EMA is above or below the EMA from 30 bars ago.
Table Display: Presents the signals in a table at the bottom-right of the chart, showing whether to buy, sell, or hold for each timeframe.
Usage Instructions:
Apply the Indicator: Add the script to your TradingView chart.
Review Signals: Observe the table to understand the current trend for each timeframe.
Adjust Settings: Customize the EMA lengths if needed to fit your trading strategy.
Example Chart:
Ensure your chart is clean, showing only the indicator table without additional clutter. The table should clearly reflect the current buy, sell, or neutral status based on the EMA calculations.
Disclaimer: This indicator is a tool for analysis and should be used in conjunction with other indicators and market research. Always test with historical data before applying it to live trading.
开源脚本
秉承TradingView的精神,该脚本的作者将其开源,以便交易者可以查看和验证其功能。向作者致敬!您可以免费使用该脚本,但请记住,重新发布代码须遵守我们的网站规则。
免责声明
这些信息和出版物并非旨在提供,也不构成TradingView提供或认可的任何形式的财务、投资、交易或其他类型的建议或推荐。请阅读使用条款了解更多信息。
免责声明
这些信息和出版物并非旨在提供,也不构成TradingView提供或认可的任何形式的财务、投资、交易或其他类型的建议或推荐。请阅读使用条款了解更多信息。