OPEN-SOURCE SCRIPT
已更新 Dynamic 4-Hour Candle (Accurate Highs and Lows)
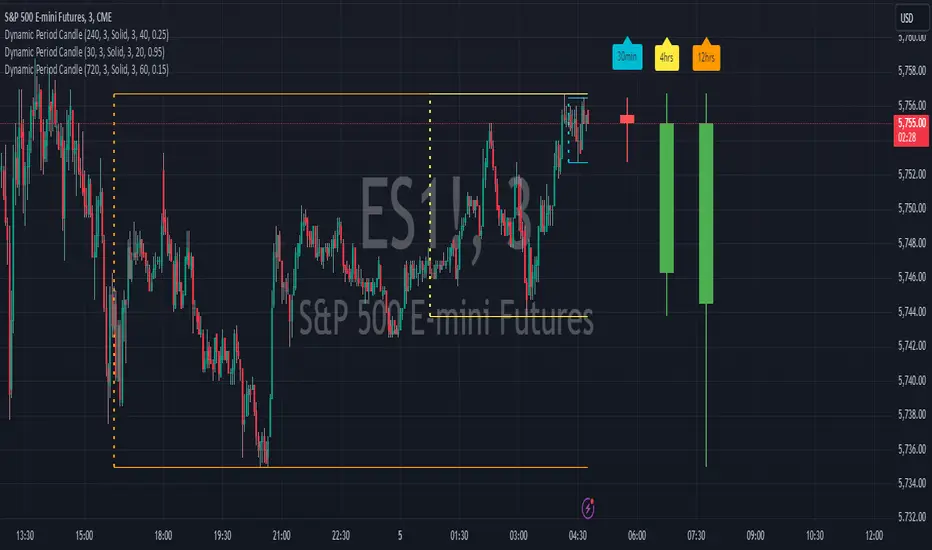
This gives a dynamic 4 hour history of the current price, so that you can assess the current trend. I found lots of indicators that looked at the previous 4 hr candle, but they then immediately switched to the new 4 hr candle when it started to be formed. this indicator looks back at the rolling previous 4 hours.
版本注释
This is version 2 of this indicator. It allows you to change the look back period and the time frame of the chart that you are using it on. 版本注释
I also think that the candle is more accurate now in its representation of the previous time period specified, but please feel free to improve on this yourselves!版本注释
added a setting to reposition the indicator on the chart版本注释
I've added a label that you can put above the candle, as it can be useful having a few of these on the chart covering different time frames, and the labels avoid any confusion as to what each candle represents.版本注释
I've now added a line that you can add on the chart to show where each look back period is. This can be colour coded to match your labels, so you can clearly see which time period is being measured by witch line.版本注释
Tidied teh label so that it now displays the hours instead of the minutes, if necessary.版本注释
Added in optional high low lines on the chart for the time period, so you can easily see them if you prefer to have them up on the chart.开源脚本
秉承TradingView的精神,该脚本的作者将其开源,以便交易者可以查看和验证其功能。向作者致敬!您可以免费使用该脚本,但请记住,重新发布代码须遵守我们的网站规则。
免责声明
这些信息和出版物并非旨在提供,也不构成TradingView提供或认可的任何形式的财务、投资、交易或其他类型的建议或推荐。请阅读使用条款了解更多信息。
免责声明
这些信息和出版物并非旨在提供,也不构成TradingView提供或认可的任何形式的财务、投资、交易或其他类型的建议或推荐。请阅读使用条款了解更多信息。