OPEN-SOURCE SCRIPT
已更新 Crunchster's Real Price
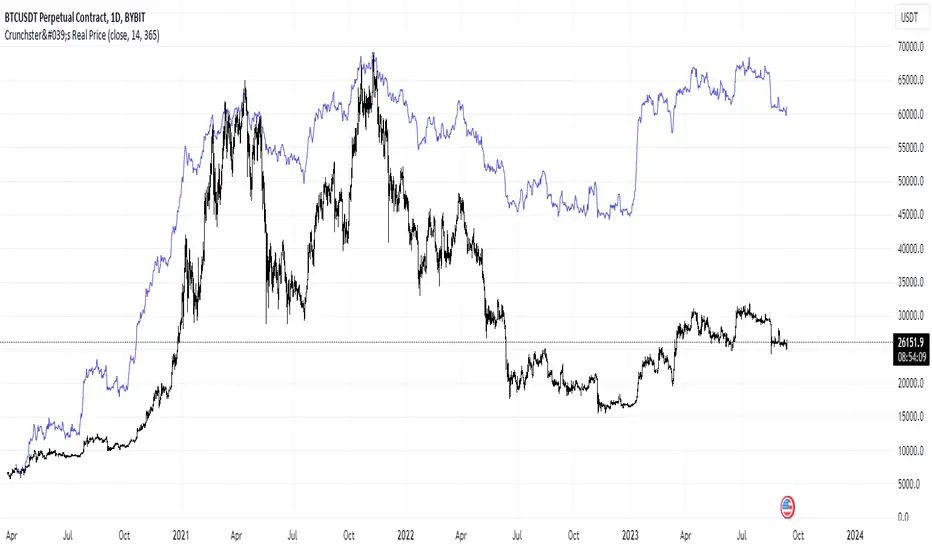
This is a simple transformation of any price series (best suited to daily timeframe) that filters out random price fluctuations and revealing the "real" price action. It allows comparison between different assets easily and is a useful confirmation of support and resistance levels, or can be used with other technical analysis.
In the default settings based on a daily chart, the daily returns are first calculated, then volatility normalised by dividing by the standard deviation of daily returns over the defined lookback period (14 periods by default).
These normalised returns are then added together over the entire price series period, to create a new "Real price" - the volatility adjusted price. This is the default presentation.
In addition, a second signal ("Normalised price series over rolling period") is available which, instead of summing the normalised returns over the entire price series, allows a user configurable, rolling lookback window over which the normalised returns are summed up. The default setting is 365 periods (ie 1 year on the daily timeframe for tickers with 24hr markets such as crypto. This can be set to 252 periods if analysing equities, which only trade 5 days per week, or any other user defined period of interest).
版本注释
Added configurable source版本注释
Updated to overlay main chart开源脚本
秉承TradingView的精神,该脚本的作者将其开源,以便交易者可以查看和验证其功能。向作者致敬!您可以免费使用该脚本,但请记住,重新发布代码须遵守我们的网站规则。
Join me on Mizar.com and trade my strategies
免责声明
这些信息和出版物并非旨在提供,也不构成TradingView提供或认可的任何形式的财务、投资、交易或其他类型的建议或推荐。请阅读使用条款了解更多信息。
开源脚本
秉承TradingView的精神,该脚本的作者将其开源,以便交易者可以查看和验证其功能。向作者致敬!您可以免费使用该脚本,但请记住,重新发布代码须遵守我们的网站规则。
Join me on Mizar.com and trade my strategies
免责声明
这些信息和出版物并非旨在提供,也不构成TradingView提供或认可的任何形式的财务、投资、交易或其他类型的建议或推荐。请阅读使用条款了解更多信息。