OPEN-SOURCE SCRIPT
MA Streak Can Show When a Run Is Getting Long in the Tooth
Moving averages are one of the most common indicators in the world of technical analysis. And they’re often the ingredients of more complex indicators like MACD.
Today’s script shows how long prices have been moving in a given direction. Similar to our earlier Price Streak script, MA Streak counts the number of sessions that the average is rising or falling. It then plots the result in green (positive, rising) or red (negative, falling).
Because it uses a moving average instead of individual candles, this smooths out short-term noise to illustrate how long prices have been moving in a given direction.
Users can designate which price value (open, high, low, etc) to use under the Source input. They can also chose one of five moving average types. (See the code for a complete guide.)
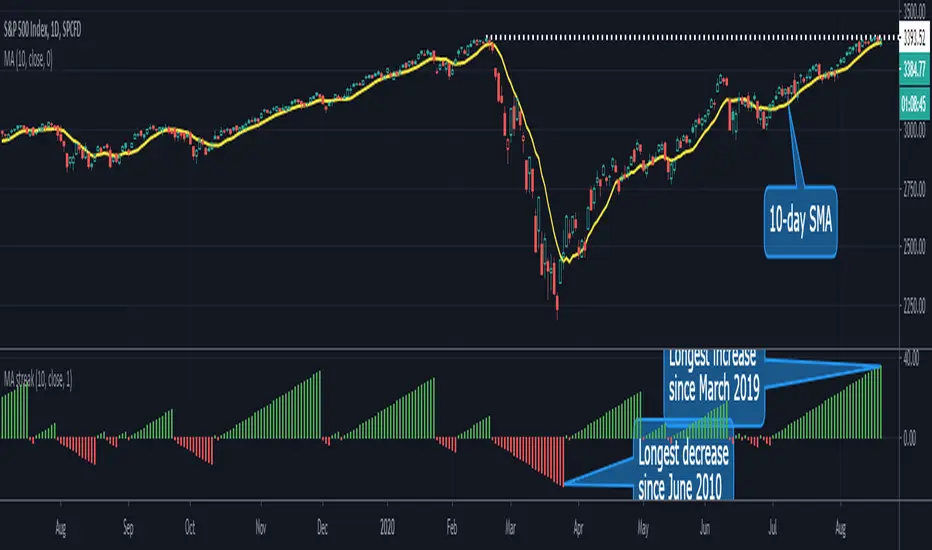
Today’s chart shows that the S&P 500’s 10-day simple moving average (SMA) has been rising for 36 sessions. It’s the longest upside run since March 2019. Given the fact that the index is flirting with its pre-Covid highs, MA Streak may suggest the current rally is getting long in the tooth.
It's also noteworthy that the coronavirus correction in February and March saw the 10-day SMA drop for 24 straight sessions, which was its longest decline since June 2010.
Today’s script shows how long prices have been moving in a given direction. Similar to our earlier Price Streak script, MA Streak counts the number of sessions that the average is rising or falling. It then plots the result in green (positive, rising) or red (negative, falling).
Because it uses a moving average instead of individual candles, this smooths out short-term noise to illustrate how long prices have been moving in a given direction.
Users can designate which price value (open, high, low, etc) to use under the Source input. They can also chose one of five moving average types. (See the code for a complete guide.)
Today’s chart shows that the S&P 500’s 10-day simple moving average (SMA) has been rising for 36 sessions. It’s the longest upside run since March 2019. Given the fact that the index is flirting with its pre-Covid highs, MA Streak may suggest the current rally is getting long in the tooth.
It's also noteworthy that the coronavirus correction in February and March saw the 10-day SMA drop for 24 straight sessions, which was its longest decline since June 2010.
开源脚本
秉承TradingView的精神,该脚本的作者将其开源,以便交易者可以查看和验证其功能。向作者致敬!您可以免费使用该脚本,但请记住,重新发布代码须遵守我们的网站规则。
免责声明
这些信息和出版物并非旨在提供,也不构成TradingView提供或认可的任何形式的财务、投资、交易或其他类型的建议或推荐。请阅读使用条款了解更多信息。
开源脚本
秉承TradingView的精神,该脚本的作者将其开源,以便交易者可以查看和验证其功能。向作者致敬!您可以免费使用该脚本,但请记住,重新发布代码须遵守我们的网站规则。
免责声明
这些信息和出版物并非旨在提供,也不构成TradingView提供或认可的任何形式的财务、投资、交易或其他类型的建议或推荐。请阅读使用条款了解更多信息。