OPEN-SOURCE SCRIPT
Strong Support and Resistance with EMAs @viniciushadek
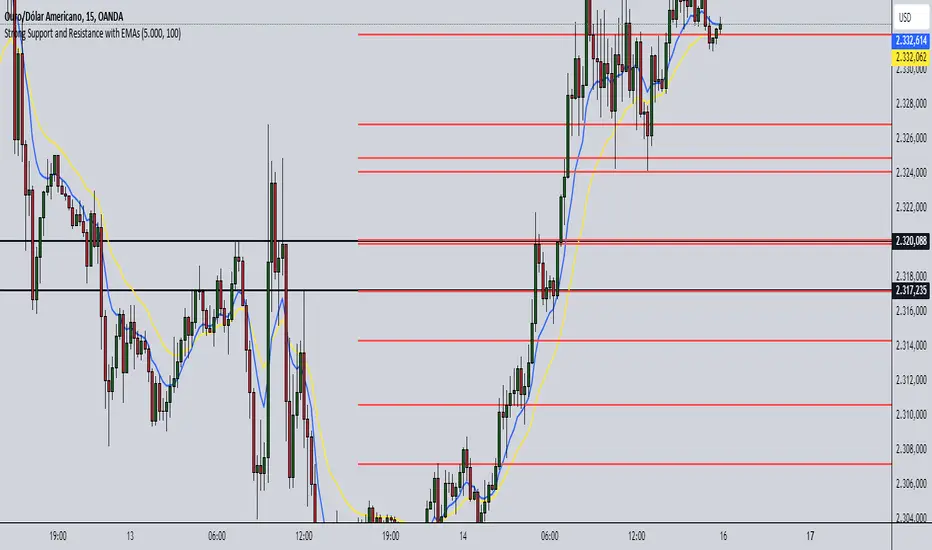
This strategy involves using two exponential moving averages (EMA) - one with a 20-period and another with a 9-period - along with identifying support and resistance levels on the chart. Combining these tools can help determine trend continuation points and potential entry and exit points in market operations.
### 1. Setting Up the Exponential Moving Averages
- **20-Period EMA**: This moving average provides a medium-term trend view. It helps smooth out price fluctuations and identify the overall market direction.
- **9-Period EMA**: This moving average is more sensitive and reacts more quickly to price changes, providing short-term signals.
### 2. Identifying Support and Resistance
- **Support**: Price levels where demand is strong enough to prevent the price from falling further. These levels are identified based on previous lows.
- **Resistance**: Price levels where supply is strong enough to prevent the price from rising further. These levels are identified based on previous highs.
### 3. Continuity Points
The strategy focuses on identifying trend continuation points using the interaction between the EMAs and the support and resistance levels.
### 4. Buy Signals
- When the 9-period EMA crosses above the 20-period EMA.
- Confirm the entry if the price is near a support level or breaking through a resistance level.
### 5. Sell Signals
- When the 9-period EMA crosses below the 20-period EMA.
- Confirm the exit if the price is near a resistance level or breaking through a support level.
### 6. Risk Management
- Use appropriate stops below identified supports for buy operations.
- Use appropriate stops above identified resistances for sell operations.
### 7. Validating the Trend
- Check if the trend is validated by other technical indicators, such as the Relative Strength Index (RSI) or Volume.
### Conclusion
This strategy uses the combination of exponential moving averages and support and resistance levels to identify continuity points in the market trend. It is crucial to confirm the signals with other technical analysis tools and maintain proper risk management to maximize results and minimize losses.
Implementing this approach can provide a clearer view of market movements and help make more informed trading decisions.
开源脚本
秉承TradingView的精神,该脚本的作者将其开源,以便交易者可以查看和验证其功能。向作者致敬!您可以免费使用该脚本,但请记住,重新发布代码须遵守我们的网站规则。
免责声明
这些信息和出版物并非旨在提供,也不构成TradingView提供或认可的任何形式的财务、投资、交易或其他类型的建议或推荐。请阅读使用条款了解更多信息。
开源脚本
秉承TradingView的精神,该脚本的作者将其开源,以便交易者可以查看和验证其功能。向作者致敬!您可以免费使用该脚本,但请记住,重新发布代码须遵守我们的网站规则。
免责声明
这些信息和出版物并非旨在提供,也不构成TradingView提供或认可的任何形式的财务、投资、交易或其他类型的建议或推荐。请阅读使用条款了解更多信息。