OPEN-SOURCE SCRIPT
Fixed Range Footprint
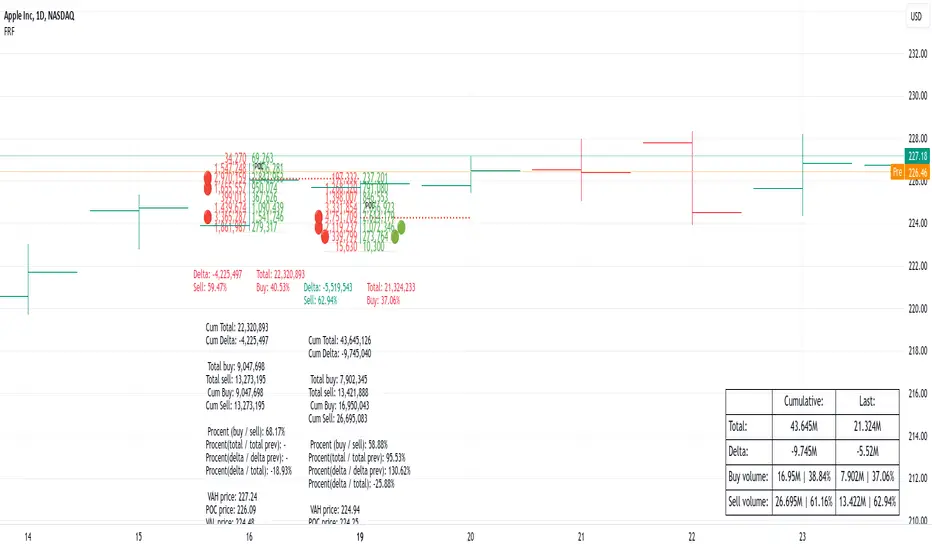
Fixed Range Footprint allows you to analyze the Footprint over a specified time period. By enabling the "Extend Right" option, the Footprint transforms into a classic mode, extending from the starting point to the most recent bar in real-time.
Input Options:
Group: Coordinates
"Start range": Defines the starting coordinate for the Footprint period.
"End range": Defines the ending coordinate for the Footprint period.
Group: Row Size
"Ticks Per Row": Directly sets the price step, calculated by multiplying the input value by syminfo.mintick.
"Auto": Activates automatic mode for selecting the "Ticks Per Row" value.
"Max row": Relevant in auto mode; it limits the number of rows within a bar. The automatic calculation for "Ticks Per Row" is based on the first available bar and applied to subsequent bars.
Group: Imbalance
"Imbalance Percent": Sets a percentage-based coefficient to determine price level Imbalance by comparing the diagonal buy price to the previous sell price.
"Stacked levels": Defines the minimum number of consecutive Imbalance levels required to draw extended lines.
Group: Support
"Show Footprint Info": Toggles the display of Footprint information.
Group: Value Area
"Value Area": Sets the percentage for the Value Area.
"POC": Toggles the Point of Control (POC).
"VAH": Toggles the Value Area High (VAH).
"VAL": Toggles the Value Area Low (VAL).
"Show Volume Profile": Displays buy/sell volume at each level.
Group: Alerts
"Alert on New Imbalance": Enables alerts for the creation of new Imbalance levels.
"Alert on New Imbalance Line": Enables alerts for the creation of new Imbalance lines.
"Alert on Stop Past Imbalance Line": Enables alerts when price stops past an Imbalance line.
开源脚本
秉承TradingView的精神,该脚本的作者将其开源,以便交易者可以查看和验证其功能。向作者致敬!您可以免费使用该脚本,但请记住,重新发布代码须遵守我们的网站规则。
免责声明
这些信息和出版物并非旨在提供,也不构成TradingView提供或认可的任何形式的财务、投资、交易或其他类型的建议或推荐。请阅读使用条款了解更多信息。
开源脚本
秉承TradingView的精神,该脚本的作者将其开源,以便交易者可以查看和验证其功能。向作者致敬!您可以免费使用该脚本,但请记住,重新发布代码须遵守我们的网站规则。
免责声明
这些信息和出版物并非旨在提供,也不构成TradingView提供或认可的任何形式的财务、投资、交易或其他类型的建议或推荐。请阅读使用条款了解更多信息。