OPEN-SOURCE SCRIPT
Plot Real Open and Close - SamX
已更新
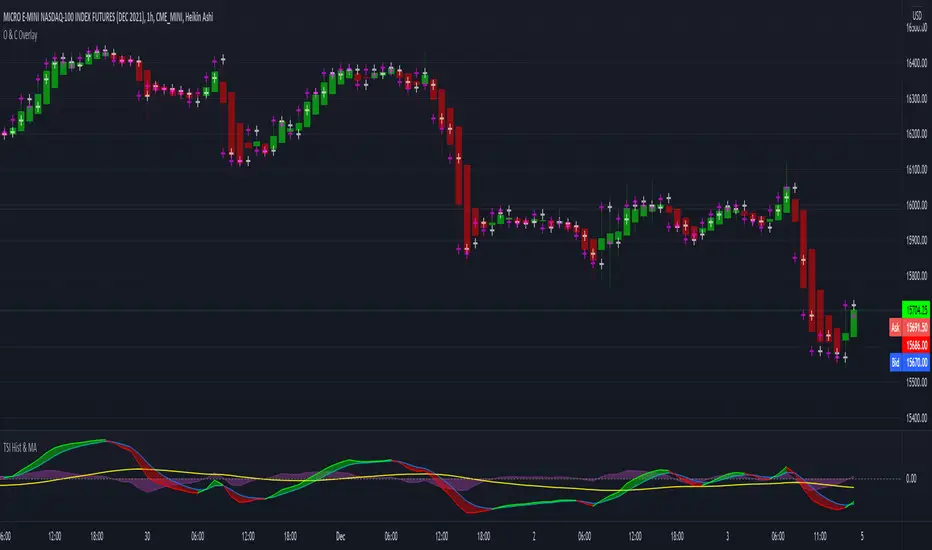
I built this indicator as a personal request from a friend. He often trades using Heiken Ashi charts, but wanted a way to easily cross-reference real-price open and close values for the same timeframe on the same chart (as HA candles are by design lagging, they can take a few periods to catch up to a large move). This can also be used to help guide support and resistance zones using real-price data points should you so choose.
There are 2 major ways to configure this indicator to display real-price open and close:
There are 2 major ways to configure this indicator to display real-price open and close:
- As a Bar or Hollow Candle style chart overlay
- As on-chart shapes (allowing individual control over which data to show - open, close, or both)
版本注释
Added the ability to plot an updating line tracking current real price.版本注释
Added option to extend the live-price line indefinitely to the left as well.开源脚本
本着真正的TradingView精神,此脚本的作者已将其开源,以便交易者可以理解和验证它。向作者致敬!您可以免费使用它,但在出版物中重复使用此代码受网站规则约束。 您可以收藏它以在图表上使用。
免责声明
这些信息和出版物并不意味着也不构成TradingView提供或认可的金融、投资、交易或其它类型的建议或背书。请在使用条款阅读更多信息。