OPEN-SOURCE SCRIPT
CARNAC Elasticity Indicator
已更新
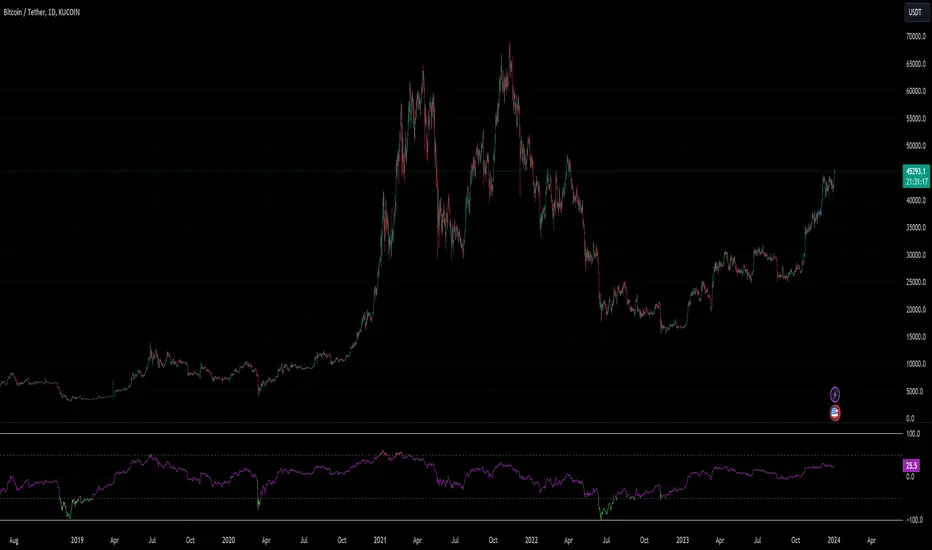
The CARNAC Elasticity Indicator (EI) is a technical analysis tool designed for traders and investors using TradingView. It calculates the percentage deviation of the current price from an Exponential Moving Average (EMA) and helps traders identify potential overbought and oversold conditions in a financial instrument.
Key Features:
EMA Length: Users can customize the length of the Exponential Moving Average (EMA) used in the calculations by adjusting the "EMA Length" parameter in the indicator settings.
Percentage Deviation: The indicator calculates the percentage deviation of the current price from the EMA. Positive values indicate prices above the EMA, while negative values indicate prices below the EMA.
Maximum Deviations: The indicator tracks the maximum positive (above EMA) and negative (below EMA) percentage deviations over time, allowing traders to monitor extreme price movements.
Bands: Upper and lower bands are displayed on the indicator chart at 100 and -100, respectively. Additionally, dashed middle bands at 50 and -50 provide reference points for moderate deviations.
Dynamic Color Coding: The indicator uses dynamic color coding to highlight the current percentage deviation. It turns red for values above 50 (indicating potential overbought conditions), green for values below -50 (indicating potential oversold conditions), and purple for values in between.
How to Use:
Overbought Conditions: Watch for the percentage deviation to cross above 50, indicating potential overbought conditions. This might be a signal to consider selling or taking profits.
Oversold Conditions: Look for the percentage deviation to cross below -50, signaling potential oversold conditions. This could be an opportunity to consider buying or entering a long position.
Historical Extremes: Keep an eye on the upper and lower bands (100 and -100) to identify historical extremes in percentage deviation.
The CARNAC Elasticity Indicator can be a valuable tool for traders seeking to identify potential trend reversals and assess the strength of price movements. However, it should be used in conjunction with other technical analysis tools and risk management strategies for comprehensive trading decisions.
版本注释
Added optional lines that track the deviation values for candle highs and lows. Can be toggled on or off in settings.版本注释
Update the script to make sure the script loads in a panel below the primary chart instead of overlaying.开源脚本
本着真正的TradingView精神,此脚本的作者已将其开源,以便交易者可以理解和验证它。向作者致敬!您可以免费使用它,但在出版物中重复使用此代码受网站规则约束。 您可以收藏它以在图表上使用。
免责声明
这些信息和出版物并不意味着也不构成TradingView提供或认可的金融、投资、交易或其它类型的建议或背书。请在使用条款阅读更多信息。