OPEN-SOURCE SCRIPT
已更新 Price Data Label

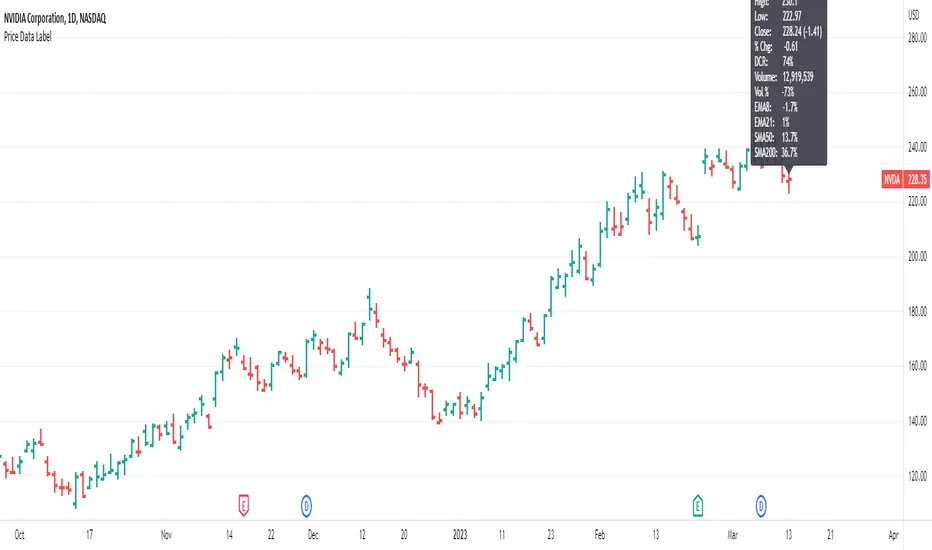
This indicator gives you the ability to see historical data for each bar on the chart by simply hovering over the high of the bar, similar to the functionality of MarketSmith.
Data for each bar includes:
Example of stats on a historical bar:

* Note this only works on the last 500 historical bars. If you use bar replay it will work with 500 historical bars from the last bar.
* If you have multiple indicators on your chart, in order to see the data you will need to use visual order to bring to front. This can be done by clicking the three dots next to the indicator name and selecting visual order.

Data for each bar includes:
- Open
- High
- Low
- Close + Change
- Percentage Change
- Closing Range
- Volume
- Volume Percent based on 50 day average
- Distance to 4 selectable moving averages
Example of stats on a historical bar:
* Note this only works on the last 500 historical bars. If you use bar replay it will work with 500 historical bars from the last bar.
* If you have multiple indicators on your chart, in order to see the data you will need to use visual order to bring to front. This can be done by clicking the three dots next to the indicator name and selecting visual order.
版本注释
Turned off the label always showing that was needed for picture. 版本注释
Added moving average values to the label版本注释
Update to show index volume for the Nasdaq and SPX as well as calculate the index volume percent change vs 50 day average volume. 版本注释
Update now allows for selectable weekly moving averages. The label will automatically adjust to the user selected weekly moving averages when looking at a weekly chart. 版本注释
Volume % calculation is now based on the run rate to show the projected volume finish compared to the average volume. 版本注释
Added a new required parameter to the time format function in the code.版本注释
option to view % as ATR开源脚本
秉承TradingView的精神,该脚本的作者将其开源,以便交易者可以查看和验证其功能。向作者致敬!您可以免费使用该脚本,但请记住,重新发布代码须遵守我们的网站规则。
Trusted Pine programmer. Send me a message for script development.
免责声明
这些信息和出版物并非旨在提供,也不构成TradingView提供或认可的任何形式的财务、投资、交易或其他类型的建议或推荐。请阅读使用条款了解更多信息。
开源脚本
秉承TradingView的精神,该脚本的作者将其开源,以便交易者可以查看和验证其功能。向作者致敬!您可以免费使用该脚本,但请记住,重新发布代码须遵守我们的网站规则。
Trusted Pine programmer. Send me a message for script development.
免责声明
这些信息和出版物并非旨在提供,也不构成TradingView提供或认可的任何形式的财务、投资、交易或其他类型的建议或推荐。请阅读使用条款了解更多信息。