PROTECTED SOURCE SCRIPT
已更新 Stochastic RSMFI Ribbon
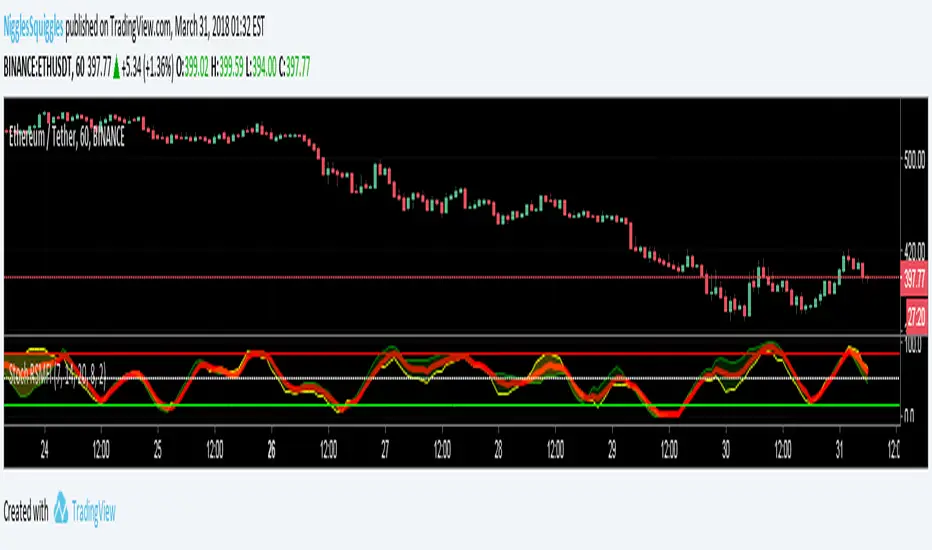
For those of you who like to use the StochasticRSI, this indicator adds a StochasticMFI (Money Flow) into the mix, making it volume weighted.
The red signal line is the StochasticRSI and StochasticMFI averaged together.
The green and yellow ribbon is the two plot lines filled in and coloured depending on which is greater (RSI or MFI).
// Created 2018 - by squiggles#8806
// LTC Tip Jar: LX4bUBdjiRPsagUbZoAczSGgDC4YqTJL7w
The red signal line is the StochasticRSI and StochasticMFI averaged together.
The green and yellow ribbon is the two plot lines filled in and coloured depending on which is greater (RSI or MFI).
// Created 2018 - by squiggles#8806
// LTC Tip Jar: LX4bUBdjiRPsagUbZoAczSGgDC4YqTJL7w
版本注释
Added the ability to plot standard RSI and MFI alongside the ribbon, I also made it so you can turn them all on or off as you wish.To make viewing RSI and MFI easier while the ribbon is visible, I made it so the RSI and MFI can be offset.
The RSI and MFI plot lines will also highlight when they are beyond the standard limits (RSI - 70, 30; MFI - 80, 20)
So now this indicator is three indicators in one...
Enjoy!!!
受保护脚本
此脚本以闭源形式发布。 但是,您可以自由使用,没有任何限制 — 了解更多信息这里。
免责声明
这些信息和出版物并非旨在提供,也不构成TradingView提供或认可的任何形式的财务、投资、交易或其他类型的建议或推荐。请阅读使用条款了解更多信息。
受保护脚本
此脚本以闭源形式发布。 但是,您可以自由使用,没有任何限制 — 了解更多信息这里。
免责声明
这些信息和出版物并非旨在提供,也不构成TradingView提供或认可的任何形式的财务、投资、交易或其他类型的建议或推荐。请阅读使用条款了解更多信息。