OPEN-SOURCE SCRIPT
已更新 Uber Stochastic Index v2 + Histogram
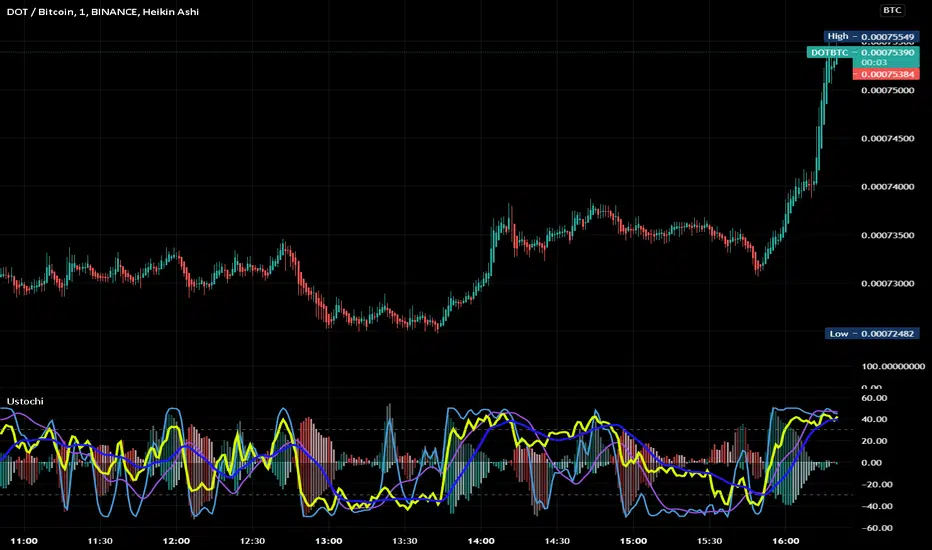
Realized how useful a histogram could be for a Stochastic, so I added it to my Uber Stochastic. It actually has two histograms - one on the primary stochastic, and one on a stochastic of the stochastic. So you can histogram while you histogram and stoch while you stoch.
The second stoch is actually really useful sometimes as a early warning but can get ugly on some settings. The histograms are also quite fast on fast settings.
What separates the Uber from the standard stoch? Well, you get 7 K stochastics, technically, to weigh together into one. Looks like one, but I assure you its 7 complete stochastics. You can have a long term stochastic with short term influence or a short term with long term influence, or have one thats all-encompassing.
Why histograms? Stochastic is already read similar to MACD, with crossover signals derived from two lines reflected in one another, one slower then the other. It just makes sense. This way, with a slower running histogram, you can more readily "see" it close in. After all, the best trades are rarely made when the stochastic crosses, but rather as it approaches crossing.
I included a lot of settings for max tweaking. The histograms seem to shift in size considerably depending how you have it set, hence the resolution settings for each. I actually recommend setting the 2nd histogram to inverted resolution, that way you can see them more clearly, but you will also see them on both sides of 0.
And yes, I offset the stochastic so the histogram would look right.
"Wealth beyond measure, Outlander" -Unknown Dunmer
版本注释
Just changed plotline order (plots were behind histogram previously... at least the histograms were translucent!) and colors for visiblity.版本注释
Just a better chart... Woops. Last one was clutter. Got a report for that earlier already... hopefully updating a script to update a chart to avoid breaking a rule isn't breaking the rules. Maybe they should add an option to replace charts...版本注释
Fixed the colors. It now shows the colors you would expect for the histogram.Also changed divergence settings to hidden and 1 lookback right when you turn them on. Too many divergences. I prefer using my eyes and having the ability to get some help.
Also changed histogram 2 to inverted for better visibility.
开源脚本
秉承TradingView的精神,该脚本的作者将其开源,以便交易者可以查看和验证其功能。向作者致敬!您可以免费使用该脚本,但请记住,重新发布代码须遵守我们的网站规则。
免责声明
这些信息和出版物并非旨在提供,也不构成TradingView提供或认可的任何形式的财务、投资、交易或其他类型的建议或推荐。请阅读使用条款了解更多信息。
开源脚本
秉承TradingView的精神,该脚本的作者将其开源,以便交易者可以查看和验证其功能。向作者致敬!您可以免费使用该脚本,但请记住,重新发布代码须遵守我们的网站规则。
免责声明
这些信息和出版物并非旨在提供,也不构成TradingView提供或认可的任何形式的财务、投资、交易或其他类型的建议或推荐。请阅读使用条款了解更多信息。