OPEN-SOURCE SCRIPT
Volatility/Volume Impact
We often hear statements such as follow the big volume to project possible price movements. Or low volatility is good for trend. How much of it is statistically right for different markets. I wrote this small script to study the impact of Volatility and Volume on price movements.
Concept is as below:
Similar calculation also applied for volatility.
With this, you can observe how price change is correlated to high/low volume and volatility.
Let us see some examples on different markets.
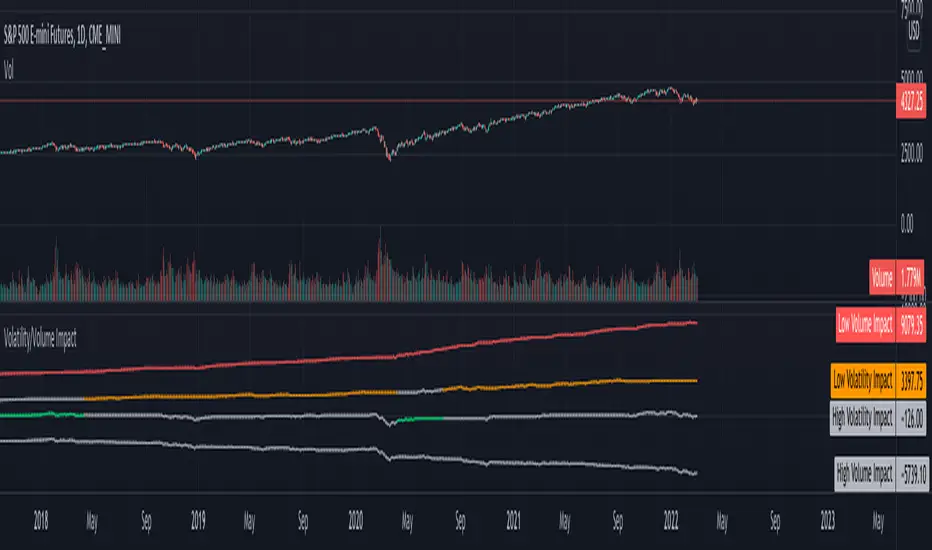
Example 1: SPY
SPY
From the chart snapshot below, it looks evident that SPY always thrive when there is low volatility and LOW VOLUME!!
https://www.tradingview.com/x/9sq1sUoN/
Example 2: TSLA
TSLA
The picture will be different if you look at individual stocks. For Tesla, the price movement is more correlated to high volume (unlike SPY where low volume days define the trend)
https://www.tradingview.com/x/729SP8PW/
Example 3:
 BTCUSDT
Unlike stocks and indices, high volatility defined the trend for BTC for long time. It thrived when volatility is more. We can see that high volume is still major influencer in BTC price movements.
https://www.tradingview.com/x/5GoJrgyM/
Settings are very simple and self explanatory.
https://www.tradingview.com/x/axehSIFT/
Hint: You can also move the indicator to chart overlay for better visualisation of comparison with close price.
https://www.tradingview.com/x/IurS9noh/
Concept is as below:
- Compare volume with a reference median value. You can also use moving average or other types for this comparison.
- If volume is higher than median, increment positive value impact with change in close price. If volume is less than median, then increment negative value impact with change in close price.
- With this we derive pvd and nvd which are measure of price change when volume is higher and lower respectively. pvd measures the price change when volume is higher than median whereas nvd measures price change when volume is lower than median.
- Calculate correlation of pvd and nvd with close price to see what is impacting the price by higher extent.
- Colors are applied to plots which have higher correlation to price movement. For example, if pvd has higher correlation to price movement, then pvd is coloured green whereas nvd is coloured silver. Similarly if nvd has higher correlation to price then nvd is coloured in red whereas pvd is coloured in silver.
Similar calculation also applied for volatility.
With this, you can observe how price change is correlated to high/low volume and volatility.
Let us see some examples on different markets.
Example 1:
From the chart snapshot below, it looks evident that SPY always thrive when there is low volatility and LOW VOLUME!!
https://www.tradingview.com/x/9sq1sUoN/
Example 2:
The picture will be different if you look at individual stocks. For Tesla, the price movement is more correlated to high volume (unlike SPY where low volume days define the trend)
https://www.tradingview.com/x/729SP8PW/
Example 3:
Unlike stocks and indices, high volatility defined the trend for BTC for long time. It thrived when volatility is more. We can see that high volume is still major influencer in BTC price movements.
https://www.tradingview.com/x/5GoJrgyM/
Settings are very simple and self explanatory.
https://www.tradingview.com/x/axehSIFT/
Hint: You can also move the indicator to chart overlay for better visualisation of comparison with close price.
https://www.tradingview.com/x/IurS9noh/
开源脚本
秉承TradingView的精神,该脚本的作者将其开源,以便交易者可以查看和验证其功能。向作者致敬!您可以免费使用该脚本,但请记住,重新发布代码须遵守我们的网站规则。
Trial - trendoscope.io/trial
Subscribe - trendoscope.io/pricing
Blog - docs.trendoscope.io
Subscribe - trendoscope.io/pricing
Blog - docs.trendoscope.io
免责声明
这些信息和出版物并非旨在提供,也不构成TradingView提供或认可的任何形式的财务、投资、交易或其他类型的建议或推荐。请阅读使用条款了解更多信息。