OPEN-SOURCE SCRIPT
已更新 Average True Range Level
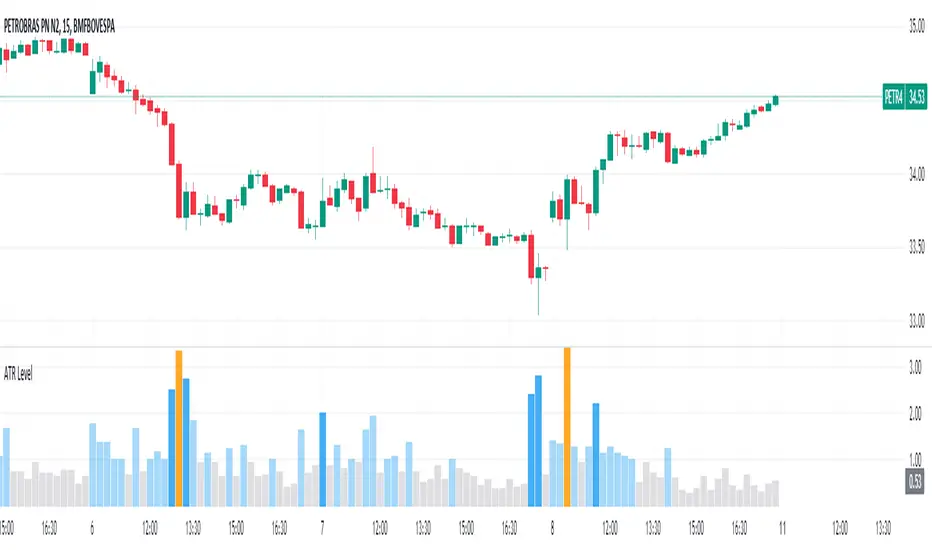
█ Overview
The indicator uses color-coded columns to represent different levels of normalized ATR, helping traders identify periods of high or low volatility.
█ Calculations
The normalization process involves dividing the current True Range by the Average True Range. The formula for normalized ATR in the code is:
Pine Script®
█ How To Use
Level < 1
During periods when the normalized ATR is less than 1, suggesting a lower level of volatility, traders may explore inside bar strategies. These strategies focus on trading within the range of the previous bar, aiming to capitalize on potential breakout opportunities.
Level between 1 and 3
In instances where the normalized ATR falls between 1 and 3, indicating moderate volatility, a pullback strategy may be considered. Traders look for temporary corrections against the prevailing trend, entering positions in anticipation of the trend's resumption
Level between 2 and 3
Within the range of normalized ATR between 2 and 3, signifying a balanced level of volatility, traders might explore breakout strategies. These strategies involve identifying potential breakout levels using support and resistance or other indicators and entering trades in the direction of the breakout.
Level > 3
When the normalized ATR exceeds 3, signaling high volatility, traders should approach with caution. While not ideal for typical mean reversion strategies, this condition may indicate that the price has become overextended. Traders might wait for subsequent candles, observing a normalized ATR between 2 and 3, to consider mean reversion opportunities after potential overpricing during the high volatility period.
* Note: These strategies are suggestions and may not be suitable for all trading scenarios. Traders should exercise discretion, conduct their own analysis, and adapt strategies based on individual preferences and risk tolerance.
The indicator uses color-coded columns to represent different levels of normalized ATR, helping traders identify periods of high or low volatility.
█ Calculations
The normalization process involves dividing the current True Range by the Average True Range. The formula for normalized ATR in the code is:
nAtr = nz(barRange/atr)
█ How To Use
Level < 1
During periods when the normalized ATR is less than 1, suggesting a lower level of volatility, traders may explore inside bar strategies. These strategies focus on trading within the range of the previous bar, aiming to capitalize on potential breakout opportunities.
Level between 1 and 3
In instances where the normalized ATR falls between 1 and 3, indicating moderate volatility, a pullback strategy may be considered. Traders look for temporary corrections against the prevailing trend, entering positions in anticipation of the trend's resumption
Level between 2 and 3
Within the range of normalized ATR between 2 and 3, signifying a balanced level of volatility, traders might explore breakout strategies. These strategies involve identifying potential breakout levels using support and resistance or other indicators and entering trades in the direction of the breakout.
Level > 3
When the normalized ATR exceeds 3, signaling high volatility, traders should approach with caution. While not ideal for typical mean reversion strategies, this condition may indicate that the price has become overextended. Traders might wait for subsequent candles, observing a normalized ATR between 2 and 3, to consider mean reversion opportunities after potential overpricing during the high volatility period.
* Note: These strategies are suggestions and may not be suitable for all trading scenarios. Traders should exercise discretion, conduct their own analysis, and adapt strategies based on individual preferences and risk tolerance.
版本注释
New input: include or exclude any gaps in current bar range calculation.版本注释
Added ATR Smoothing Input.Added rounding to the symbol's mintick in the normalized ATR calculation.
开源脚本
秉承TradingView的精神,该脚本的作者将其开源,以便交易者可以查看和验证其功能。向作者致敬!您可以免费使用该脚本,但请记住,重新发布代码须遵守我们的网站规则。
免责声明
这些信息和出版物并非旨在提供,也不构成TradingView提供或认可的任何形式的财务、投资、交易或其他类型的建议或推荐。请阅读使用条款了解更多信息。
免责声明
这些信息和出版物并非旨在提供,也不构成TradingView提供或认可的任何形式的财务、投资、交易或其他类型的建议或推荐。请阅读使用条款了解更多信息。