OPEN-SOURCE SCRIPT
已更新 [EG] MA ATR Channels
Greetings - the aim of this indicator was to code a single indicator with a selectable moving average, so I could examine price relationships to MA's and Average True Range (ATR) bollinger type bands. You can obviously approach this tool in so many different ways so I am going to share first an overview of moving averages and a short overview of how I use this this indicator.
Simple ( SMA ) – A simple average of the past N (length) prices. Just add the price data for each N (bar) and divide the total by N.
Exponential ( EMA ) – An exponential moving average with a greater weight for recent prices. The weighting is exponential. An N-period EMA takes more than N data points into account and gradually dilutes past data’s effect.
Double Exponential ( DEMA ) - Same as an EMA , the Double exponential moving average , or DEMA , is a measure of a security's trending average price that gives the even more weight to recent price data. Aimed to help reduce lag.
Triple Exponential ( TEMA ) - Same as an EMA , the Triple exponential moving average , or TEMA , is a measure of a security's trending average price that gives the even more weight to recent price data than EMA or DEMA . Aimed to help reduce lag.
Weighted ( WMA ) – An average of the past N prices with a linear weighting, again giving greater weight to more recent prices.
Hull ( HMA ) - The Hull Moving Average (developed by Alan Hull) has the purpose of reducing lag, increasing responsiveness while at the same time eliminating noise. It emphasises recent prices over older ones, resulting in a fast-acting yet smooth moving average that can be used to identify the prevailing market trend.
Wilder's (RMA) - Wilder's smoothing is a type of exponential moving average . It takes one parameter, the period n, and price. Larger values for n will have a greater smoothing effect on the input data but will also create more lag. It is equivalent to a 2n-1 Exponential Moving Average . For example, a 10 period Wilder's smoothing is the same as a 19 period exponential moving average .
Symmetrically Weighted ( SWMA ) - Weight distribution starts from median of given period and it's reduced linearly to the sides so the ending and starting point of period have the least weight. It's smooth and fast but reacts late to trend changes on higher lengths (lookback).
Arnaud Legoux ( ALMA ) - Arnaud Legoux Moving Average removes small price fluctuations and enhances trend via applying a moving average twice, once from left to right, and once from right to left and combines both. At the end of this process the phase shift (price lag) commonly associated with moving averages is significantly reduced.
Volume-Weighted ( VWMA ) - A Volume-Weighted Moving Average gives a different weight to each closing price and this weight depends on the volume of that period. For example, the closing price of a day with high volume will have a greater weight on the moving average value.
Volume Weighted Average Price ( VWAP ) - Though not necessarily a MA - Volume-weighted average price ( VWAP ) is a ratio of the cumulative share price to the cumulative volume traded over a given time period and so I thought would be useful as an ATR tool. The VWAP is calculated using the opening price for each day and adjusting in real time right up until the close of the session. Thus, the calculation uses intraday data only.
So what is Average True Range ?
Average True Range is a measure of volatility . It's an area that represents roughly how much you can expect a security to change in price over a time period. Average true range is usually calculated by applying Wilders Smoothing to True Range. If you want regular ATR - use RMA as the input for the ATR. The ATR is then divided into periods based on derivatives of Phi (3.14) and Fibs (0.618, 1.618 etc.) You will notice price bounces off the lines. Look for patterns.
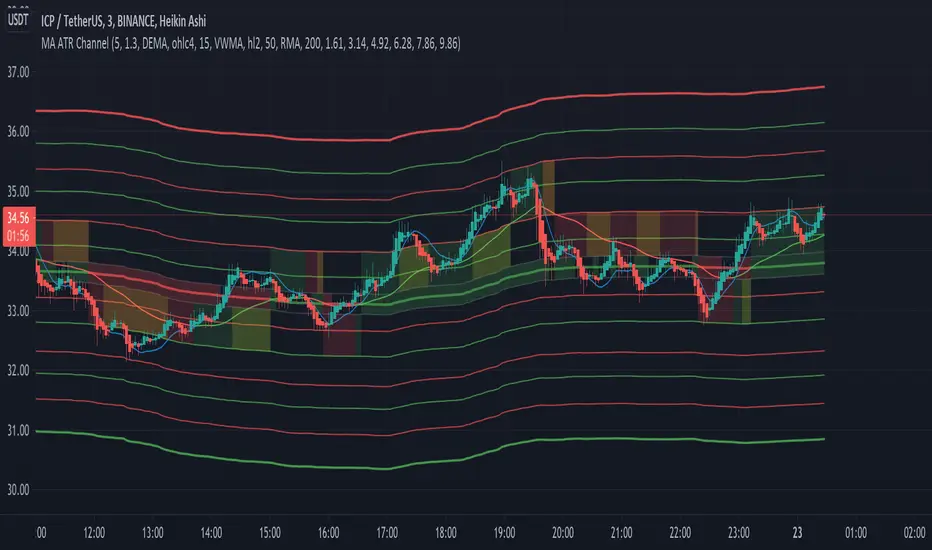
The indicator - consisting of 3 parts:
Price/Fast MA - this is an MA anywhere between 3-20 periods that is reflective of very recent price action. It is red when price is below - and green when above. Recommendations : SMA , EMA , WMA , HMA
Trend/Medium MA - this is a slower MA that you could set anywhere between 30 - 100 periods that is reflective of overall bull/bear market trend depending on both it's direction and whether the Price MA / price is lower or higher. Recommendations: EMA , WMA , VWMA , RMA, ALMA
Average True Range - this is a way to measure and visualise range the price may be capable of in - if it is towards or below the 2.1 multiplier - a bull reversal is more likely and vice versea. The multi's are set to factors of Pi and Fibonacci ratio's. Green channel means bullish, red channel means bearish. Gold means sign of a likely reversal. If the PMA enters the channel - it is likely the reversal is cancelled for a short period more.
Recommendations : RMA, EMA , VWMA , ALMA , SWMA , VWAP
How I use it :
First of all - Consider longs when channel is green - or going to bounce on a support line - and consider shorts based on the opposite. This is not a buy/sell indicator - this is a MAP to PRICE to give reference and meaning to price movements across multiple time frames - very useful when using with a volume indicator and an RSI. I personally use it on the 3m chart but change the TFM to 5 for 15m data.
If you wish to see any other more exotic or interesting MA's added please feel free to request them in the comments ! And thanks for checking out my first indicator
Simple ( SMA ) – A simple average of the past N (length) prices. Just add the price data for each N (bar) and divide the total by N.
Exponential ( EMA ) – An exponential moving average with a greater weight for recent prices. The weighting is exponential. An N-period EMA takes more than N data points into account and gradually dilutes past data’s effect.
Double Exponential ( DEMA ) - Same as an EMA , the Double exponential moving average , or DEMA , is a measure of a security's trending average price that gives the even more weight to recent price data. Aimed to help reduce lag.
Triple Exponential ( TEMA ) - Same as an EMA , the Triple exponential moving average , or TEMA , is a measure of a security's trending average price that gives the even more weight to recent price data than EMA or DEMA . Aimed to help reduce lag.
Weighted ( WMA ) – An average of the past N prices with a linear weighting, again giving greater weight to more recent prices.
Hull ( HMA ) - The Hull Moving Average (developed by Alan Hull) has the purpose of reducing lag, increasing responsiveness while at the same time eliminating noise. It emphasises recent prices over older ones, resulting in a fast-acting yet smooth moving average that can be used to identify the prevailing market trend.
Wilder's (RMA) - Wilder's smoothing is a type of exponential moving average . It takes one parameter, the period n, and price. Larger values for n will have a greater smoothing effect on the input data but will also create more lag. It is equivalent to a 2n-1 Exponential Moving Average . For example, a 10 period Wilder's smoothing is the same as a 19 period exponential moving average .
Symmetrically Weighted ( SWMA ) - Weight distribution starts from median of given period and it's reduced linearly to the sides so the ending and starting point of period have the least weight. It's smooth and fast but reacts late to trend changes on higher lengths (lookback).
Arnaud Legoux ( ALMA ) - Arnaud Legoux Moving Average removes small price fluctuations and enhances trend via applying a moving average twice, once from left to right, and once from right to left and combines both. At the end of this process the phase shift (price lag) commonly associated with moving averages is significantly reduced.
Volume-Weighted ( VWMA ) - A Volume-Weighted Moving Average gives a different weight to each closing price and this weight depends on the volume of that period. For example, the closing price of a day with high volume will have a greater weight on the moving average value.
Volume Weighted Average Price ( VWAP ) - Though not necessarily a MA - Volume-weighted average price ( VWAP ) is a ratio of the cumulative share price to the cumulative volume traded over a given time period and so I thought would be useful as an ATR tool. The VWAP is calculated using the opening price for each day and adjusting in real time right up until the close of the session. Thus, the calculation uses intraday data only.
So what is Average True Range ?
Average True Range is a measure of volatility . It's an area that represents roughly how much you can expect a security to change in price over a time period. Average true range is usually calculated by applying Wilders Smoothing to True Range. If you want regular ATR - use RMA as the input for the ATR. The ATR is then divided into periods based on derivatives of Phi (3.14) and Fibs (0.618, 1.618 etc.) You will notice price bounces off the lines. Look for patterns.
The indicator - consisting of 3 parts:
Price/Fast MA - this is an MA anywhere between 3-20 periods that is reflective of very recent price action. It is red when price is below - and green when above. Recommendations : SMA , EMA , WMA , HMA
Trend/Medium MA - this is a slower MA that you could set anywhere between 30 - 100 periods that is reflective of overall bull/bear market trend depending on both it's direction and whether the Price MA / price is lower or higher. Recommendations: EMA , WMA , VWMA , RMA, ALMA
Average True Range - this is a way to measure and visualise range the price may be capable of in - if it is towards or below the 2.1 multiplier - a bull reversal is more likely and vice versea. The multi's are set to factors of Pi and Fibonacci ratio's. Green channel means bullish, red channel means bearish. Gold means sign of a likely reversal. If the PMA enters the channel - it is likely the reversal is cancelled for a short period more.
Recommendations : RMA, EMA , VWMA , ALMA , SWMA , VWAP
How I use it :
First of all - Consider longs when channel is green - or going to bounce on a support line - and consider shorts based on the opposite. This is not a buy/sell indicator - this is a MAP to PRICE to give reference and meaning to price movements across multiple time frames - very useful when using with a volume indicator and an RSI. I personally use it on the 3m chart but change the TFM to 5 for 15m data.
If you wish to see any other more exotic or interesting MA's added please feel free to request them in the comments ! And thanks for checking out my first indicator
版本注释
- Added TEMA even faster price MA for reversal - settings of 3 - 8 suitable - Cleaned up code
开源脚本
秉承TradingView的精神,该脚本的作者将其开源,以便交易者可以查看和验证其功能。向作者致敬!您可以免费使用该脚本,但请记住,重新发布代码须遵守我们的网站规则。
免责声明
这些信息和出版物并非旨在提供,也不构成TradingView提供或认可的任何形式的财务、投资、交易或其他类型的建议或推荐。请阅读使用条款了解更多信息。
免责声明
这些信息和出版物并非旨在提供,也不构成TradingView提供或认可的任何形式的财务、投资、交易或其他类型的建议或推荐。请阅读使用条款了解更多信息。