OPEN-SOURCE SCRIPT
已更新 MACD in BANDS
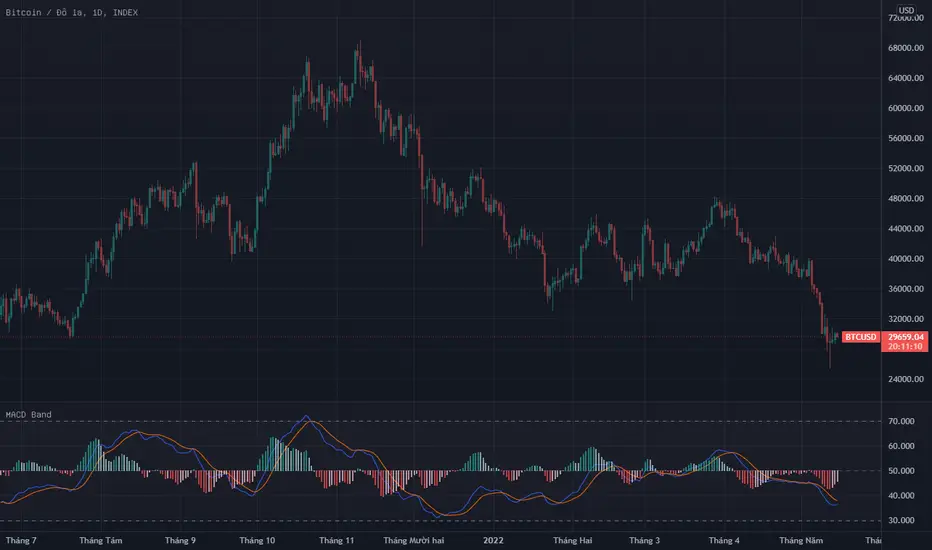
My idea is to make the MACD histogram oscillating in a range from 0-100 just like the RSI .
I did it successfully, but compared to normal MACD histogram it is too low and hard to see because most values just fluctuate slightly above or below 50. So I'm happy and grateful to anyone who can offer guidance.
Image: tradingview.com/x/kF5Ui9wY
I did it successfully, but compared to normal MACD histogram it is too low and hard to see because most values just fluctuate slightly above or below 50. So I'm happy and grateful to anyone who can offer guidance.
Image: tradingview.com/x/kF5Ui9wY
版本注释
Complete version. Better display with more options.版本注释
Only updated the title to avoid confusion with other scripts.开源脚本
秉承TradingView的精神,该脚本的作者将其开源,以便交易者可以查看和验证其功能。向作者致敬!您可以免费使用该脚本,但请记住,重新发布代码须遵守我们的网站规则。
免责声明
这些信息和出版物并非旨在提供,也不构成TradingView提供或认可的任何形式的财务、投资、交易或其他类型的建议或推荐。请阅读使用条款了解更多信息。
免责声明
这些信息和出版物并非旨在提供,也不构成TradingView提供或认可的任何形式的财务、投资、交易或其他类型的建议或推荐。请阅读使用条款了解更多信息。