OPEN-SOURCE SCRIPT
已更新 SMA Direction Cross Currency Summary
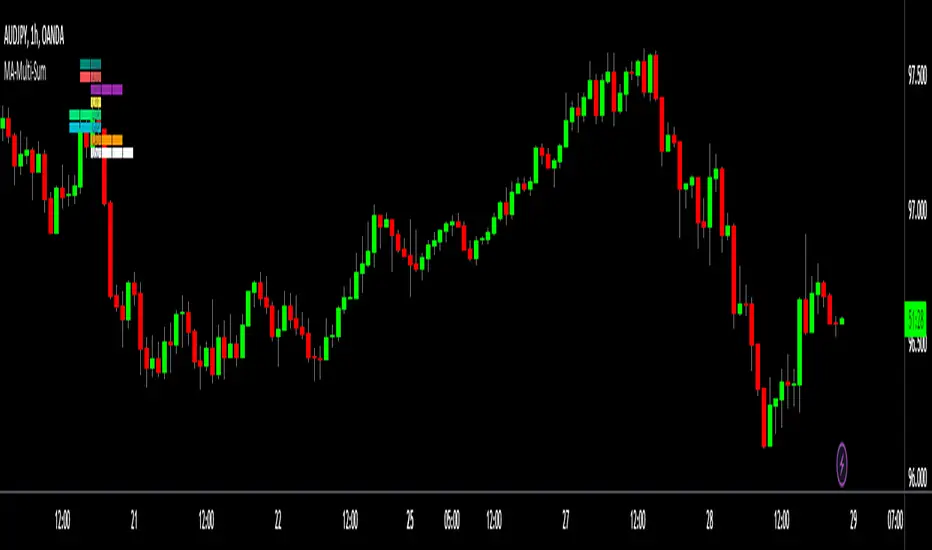
This script shows the average SMA direction of each of the majors and crosses when compared to each other. The more blocks to the right the stronger the currency on that timeframe. The more blocks to the left the weaker the currency.
I'm finding it useful to quickly know the average flow of movement for each currency on the higher timeframes and then focus on that for a daily trade. I also like how i dont have to keep jumping between instruments to stay upto date. I'm not a 'real' trader so I have very limited time and attention for this so this does the job as a crude replacement for trawling all the chart each day.

The currencies compared are:
-NZD
-AUD
-JPY
-CHF
-EUR
-GBP
-CAD
-USD
The way it is calculated is that its based on the 20 SMA. For each currency vs the other crosses:
if the SMA is pointing up and price is higher = +2
if the SMA is pointing up and price is lower = +1
if the SMA is pointing down and price is higher = -2
if the SMA is pointing down and price is lower = -1
So if we where considering GBP. We would do that for GBPNZD, GBPAUD, GBPPJY, GBPCHF, GBPEUR, GBPCAD, GBPUSD. We would then consider this sum against all the currencies to understand the relative strength.
Due to the limit on how many instruments can be called in a single indicated you need to load it for each currencies so 8 currencies = 8 indicators.
Its a bit of a frankinstien script - it just throw it togeather so its probably got redundant code etc. Its built around 20 SMA - no idea what would happens when you change that.
I'm finding it useful to quickly know the average flow of movement for each currency on the higher timeframes and then focus on that for a daily trade. I also like how i dont have to keep jumping between instruments to stay upto date. I'm not a 'real' trader so I have very limited time and attention for this so this does the job as a crude replacement for trawling all the chart each day.
The currencies compared are:
-NZD
-AUD
-JPY
-CHF
-EUR
-GBP
-CAD
-USD
The way it is calculated is that its based on the 20 SMA. For each currency vs the other crosses:
if the SMA is pointing up and price is higher = +2
if the SMA is pointing up and price is lower = +1
if the SMA is pointing down and price is higher = -2
if the SMA is pointing down and price is lower = -1
So if we where considering GBP. We would do that for GBPNZD, GBPAUD, GBPPJY, GBPCHF, GBPEUR, GBPCAD, GBPUSD. We would then consider this sum against all the currencies to understand the relative strength.
Due to the limit on how many instruments can be called in a single indicated you need to load it for each currencies so 8 currencies = 8 indicators.
Its a bit of a frankinstien script - it just throw it togeather so its probably got redundant code etc. Its built around 20 SMA - no idea what would happens when you change that.
版本注释
Now you can cover 4 currencies with 1 indicator. (2 instances will cover all 8 majors and crosses)版本注释
Now loads all currencies in 1 indicator版本注释
fixing problem开源脚本
秉承TradingView的精神,该脚本的作者将其开源,以便交易者可以查看和验证其功能。向作者致敬!您可以免费使用该脚本,但请记住,重新发布代码须遵守我们的网站规则。
免责声明
这些信息和出版物并非旨在提供,也不构成TradingView提供或认可的任何形式的财务、投资、交易或其他类型的建议或推荐。请阅读使用条款了解更多信息。
开源脚本
秉承TradingView的精神,该脚本的作者将其开源,以便交易者可以查看和验证其功能。向作者致敬!您可以免费使用该脚本,但请记住,重新发布代码须遵守我们的网站规则。
免责声明
这些信息和出版物并非旨在提供,也不构成TradingView提供或认可的任何形式的财务、投资、交易或其他类型的建议或推荐。请阅读使用条款了解更多信息。