OPEN-SOURCE SCRIPT
Guth_3X_Confirm
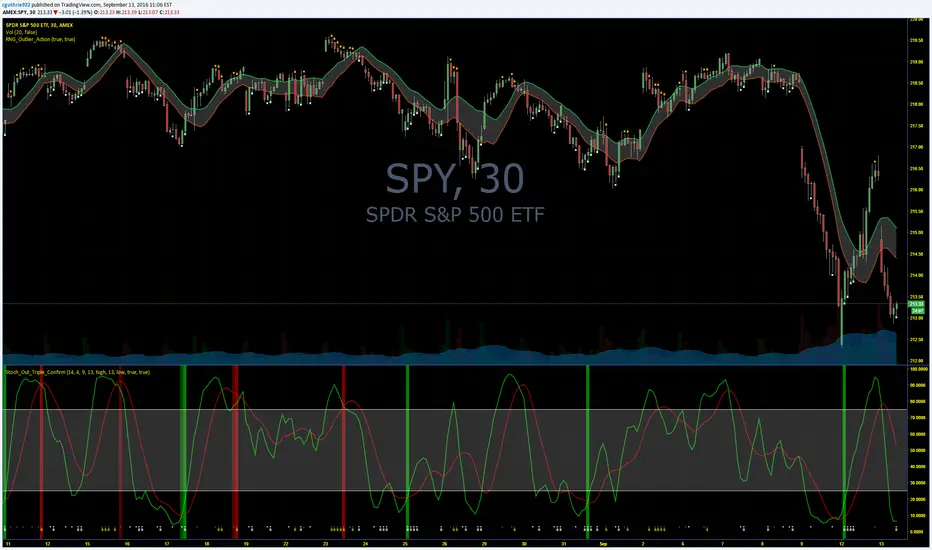
This indicator has three built in indicators based on the SMA of HIGH, SMA of LOW, and Stochastic. The baseline indicator is the retreats after departures from SMA of HIGH and LOW.
The first time a HIGH that is above the SMA HIGH has a lower HIGH but it still above the SMA HIGH, a (-) will appear at the bottom. This signals an aggressive entry point for potential coming downtrend. The second time the HIGH produces a lower high but is still above the SMA HIGH, a (S) will appear at the bottom which signals a more conservative entry point for potential coming downtrend. All of the opposite information is true of reversals beyond the SMA LOW.
When these reversals appear the same time the Stochastic is overbought or oversold, a red bar (overbought and potentially coming down) or a green bar (oversold and potentially coming up) will appear. NOTE: Aggressive symbols occur more often and will always occur when a conservative symbol appears. When a conservative indicator and respective overbought/oversold level occur at the same time, the bar is darker in color.
You can enter positions at any one of the indicators, however, the darker bars are what I look for. This has a high success rate but cannot guarantee results every time. I recommend adjusting the SMA, and Stoch parameters as well as time periods. I have had success with this indicator while day trading the 5, 10, 15, 30, 65 minute periods as well as daily and weekly periods. Every symbol traded can provide differing results based on the parameters used.
Please feel free to leave feedback and I know this can work well for you!
开源脚本
秉承TradingView的精神,该脚本的作者将其开源,以便交易者可以查看和验证其功能。向作者致敬!您可以免费使用该脚本,但请记住,重新发布代码须遵守我们的网站规则。
All forecasts are based on analysis of past behavior. Prior movements are not always indicative of future movement. Develop the theory, test the theory. Do your own research. Nothing in this analysis constitutes advice. YouTube For More. Good luck!!
免责声明
这些信息和出版物并非旨在提供,也不构成TradingView提供或认可的任何形式的财务、投资、交易或其他类型的建议或推荐。请阅读使用条款了解更多信息。