OPEN-SOURCE SCRIPT
Candle Strength Oscillator by SyntaxGeek
This candle strength oscillator displays a smoothed rolling difference between the body range (close and open) and total candle range (high and low).
When candles have small bodies, such as a doji, it can indicate weakness, when candles have essentially little to no wicks it can indicate strength.
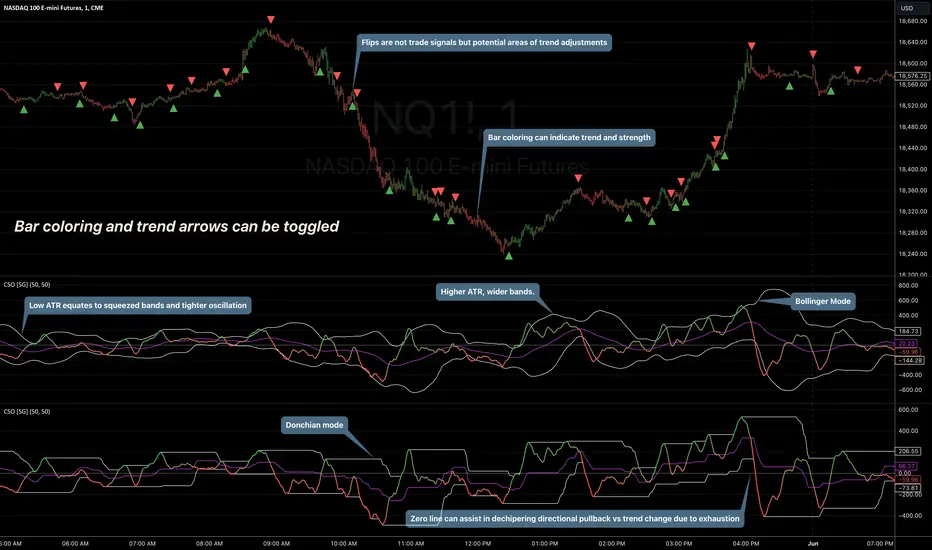
There are two modes of display for the strength trend to show potential exhaustion on either side, bollinger bands and donchian channels. Each has their own pros and cons but as most are familiar with bollinger bands this is the default.
Another feature is the ATR measurement, which can assist in displaying an overall reduction in range volatility when comparing historical price movements to current oscillations.
The zero line can show some importance with regards to the peaks and valleys of the main measurement, when everything is trending and there's a reversal, if the zero line isn't broken it could be considered a trend continuation pullback vs a complete reversal.
Trend arrows and bar coloring are available but should not be considered trade signals for entry and exit, merely just another way of viewing the lower study information.
As the raw data of each candle measurement is quite noisy, the entire dataset is passed through an HMA smoothing process, if more options are requested I'll consider adding them.
Thanks for view my script and happy trading!
When candles have small bodies, such as a doji, it can indicate weakness, when candles have essentially little to no wicks it can indicate strength.
There are two modes of display for the strength trend to show potential exhaustion on either side, bollinger bands and donchian channels. Each has their own pros and cons but as most are familiar with bollinger bands this is the default.
Another feature is the ATR measurement, which can assist in displaying an overall reduction in range volatility when comparing historical price movements to current oscillations.
The zero line can show some importance with regards to the peaks and valleys of the main measurement, when everything is trending and there's a reversal, if the zero line isn't broken it could be considered a trend continuation pullback vs a complete reversal.
Trend arrows and bar coloring are available but should not be considered trade signals for entry and exit, merely just another way of viewing the lower study information.
As the raw data of each candle measurement is quite noisy, the entire dataset is passed through an HMA smoothing process, if more options are requested I'll consider adding them.
Thanks for view my script and happy trading!
开源脚本
本着真正的TradingView精神,此脚本的作者已将其开源,以便交易者可以理解和验证它。向作者致敬!您可以免费使用它,但在出版物中重复使用此代码受网站规则约束。 您可以收藏它以在图表上使用。
@tradeseekers (YouTube, Twitter)
免责声明
这些信息和出版物并不意味着也不构成TradingView提供或认可的金融、投资、交易或其它类型的建议或背书。请在使用条款阅读更多信息。