OPEN-SOURCE SCRIPT
已更新 RSI Superstack
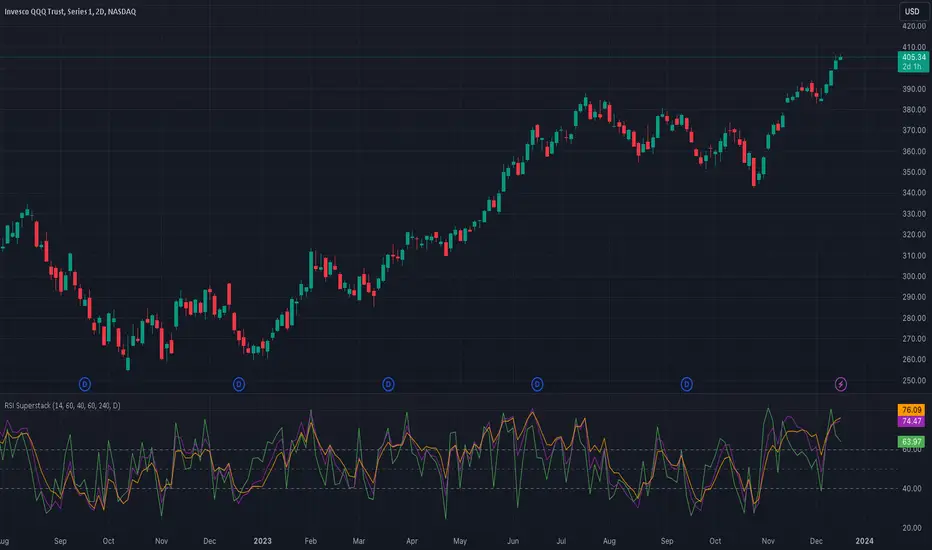
This script integrates three Relative Strength Index (RSI) indicators across multiple time frames, providing a comprehensive overview of oversold and overbought conditions. This holistic approach enhances the precision of entry and exit points on shorter time frames.
As a momentum indicator, the Relative Strength Index assesses a security's strength during upward and downward price movements within the specified time period.
In a broader context, an upward slope in all indicators (green, purple, and orange) signifies an increasing market momentum, suggesting a potential continuation of the upward trend.
More specifically, a collective upward slope reaching or surpassing the 40 level in all indicators serves as a buy signal. Conversely, a uniform downward slope descending to or below the 60 level in all indicators constitutes a sell signal.
The default time frames for analysis include:
- 1 Hour (1H)
- 4 Hours (4H)
- Daily (D)
It is imperative to note that this indicator should not serve as the sole determinant for initiating long or short positions. Instead, it is recommended to consider it as part of a broader analysis, incorporating factors such as trend analysis and significant support levels.
Disclaimer: The utilization of this indicator should complement a comprehensive analysis and not be solely relied upon for decision-making regarding long or short positions.
版本注释
This update includes the following- Add option for repainting (default is true)
Repainting allows the indicator to refresh prior to the candle completing its close, presenting both merits and drawbacks. On the positive side, it produces an early signal, empowering the trader to act on a trade before the candle concludes and verifies. Conversely, the drawback lies in the potential invalidation of the signal if the candle undergoes a significant reversal before closure, rendering it potentially false. Experienced traders may choose to exercise discretion in enabling repainting.
版本注释
This update removes dead code and invalid alert conditions.版本注释
This update includes the following- Adds a tooltip for the Enable Repainting user input
开源脚本
秉承TradingView的精神,该脚本的作者将其开源,以便交易者可以查看和验证其功能。向作者致敬!您可以免费使用该脚本,但请记住,重新发布代码须遵守我们的网站规则。
免责声明
这些信息和出版物并非旨在提供,也不构成TradingView提供或认可的任何形式的财务、投资、交易或其他类型的建议或推荐。请阅读使用条款了解更多信息。
开源脚本
秉承TradingView的精神,该脚本的作者将其开源,以便交易者可以查看和验证其功能。向作者致敬!您可以免费使用该脚本,但请记住,重新发布代码须遵守我们的网站规则。
免责声明
这些信息和出版物并非旨在提供,也不构成TradingView提供或认可的任何形式的财务、投资、交易或其他类型的建议或推荐。请阅读使用条款了解更多信息。